The Khedra Book
Khedra (prononced kɛd-ɾɑ) is an all-in-one "long-running" tool for indexing and sharing the Unchained Index and monitoring individual addresses on EVM-compatible blockchains.
The tool creates and shares the Unchained Index which is a permissionless index of "address appearances," including appearances in event logs, execution traces, incoming transactions, modifications to smart contract state, staking or block rewards, prefund allocations and many other locations.
This detailed indexing allows for near-perfect monitoring and notifications of address activity, which leads to many benefits. The benefits include native and ERC-20 account balance histories, address auditing and accounting, and even custom indexing. It works for any address on any chain (as long as you have access to the chain's RPC).
Enjoy!
Please help us improve this software by providing any feedback or suggestions. Contact information and links to our socials are available at our website.
About the Name
The name khedra (prononced kɛd-ɾɑ) is inspired by the Persian word خدمت (khedmat), meaning "service."
In ancient Persian culture, service was considered a noble pursuit, emphasizing dedication, reliability, and humility in action. Drawing from this tradition, the name khedra embodies the essence of a system designed to serve--efficiently, continuously, and with purpose.
Simliar to its counterpart, chifra (derived from the Persian word for "cipher"), the name khedra symbolizes a long-running, dependable processes that tirelessly "serves" the needs of its users.
More technically, khedra is a collection of go routines that:
- creates and publishes the Unchained Index,
- monitors a user-provided customized list of addresses automating caching, notifications, and other ETL processes,
- provides a RESTful API exposing chifra's many data access commands,
- allows for starting, stopping, pausing, and resuming these individual services.
By choosing the name khedra, we honor a legacy of service while committing to building tools that are as resilient, adaptive, and reliable as the meaning behind its name.
User Manual
Overview of Khedra
Khedra is a blockchain indexing and monitoring application designed to provide users with an efficient way to interact with and manage transactional histories for EVM-compatible blockchains. It supports functionalities such as transaction monitoring, address indexing, publishing and pinning the indexes to IPFS and a smart contract, and a RESTful API for accessing data.
Purpose of this Document
This "User's Manual" is designed to help users get started with Khedra, understand its features, and operate the application effectively for both basic and advanced use cases. For a more technical treatment of the software, refer to the Technical Specification.
Intended Audience
This manual is intended for:
- End-users looking to index and monitor blockchain data.
- Developers integrating blockchain data into their applications.
- System administrators managing blockchain-related infrastructure.
Introduction
What is Khedra?
Khedra (pronounced kɛd-ɾɑ) is TrueBlocks' service management system that provides blockchain indexing, monitoring, and data serving capabilities for EVM-compatible blockchains. It creates and maintains the Unchained Index - a comprehensive, permissionless index of address appearances across blockchain data.
At its core, Khedra creates and maintains the Unchained Index - a permissionless index of address appearances across blockchain data, including transactions, event logs, execution traces, and more. This detailed indexing enables powerful monitoring capabilities for any address on any supported chain.
Key Features
1. Comprehensive Indexing
The Scraper service indexes address appearances from multiple sources:
- Transaction senders and recipients
- Event log topics and data fields
- Internal calls from execution traces
- Block rewards and consensus activities
This detailed indexing enables fast lookups of any address's complete on-chain history.
2. Address Monitoring
The Monitor service provides real-time tracking of specific addresses:
- Detects new transactions involving monitored addresses
- Captures relevant events and interactions
- Supports monitoring multiple addresses simultaneously
3. Service Management
Khedra operates through five core services with runtime control:
- Scraper: Builds and maintains the Unchained Index (pausable)
- Monitor: Tracks specific addresses (pausable)
- API: Provides REST endpoints for data access
- Control: HTTP interface for service management
- IPFS: Distributed data sharing (optional)
Services marked as pausable can be stopped and resumed without restarting the entire system.
4. Multi-Chain Support
While Ethereum mainnet is the primary focus, Khedra supports any EVM-compatible blockchain:
- Test networks (Sepolia, Goerli)
- Layer 2 solutions (Optimism, Arbitrum, Polygon)
- Alternative EVMs (Gnosis Chain, Base)
Each chain requires only a valid RPC endpoint to begin indexing.
5. Privacy-Preserving Design
Khedra runs entirely on your local machine:
- No data sent to third-party servers
- Complete control over your queries and data
- Local-first architecture for maximum privacy
Architecture
Service Communication
Services communicate through:
- Shared configuration system
- HTTP APIs for control operations
- Local file system for data storage
- Optional IPFS for distributed sharing
Runtime Control
The Control service provides HTTP endpoints for:
- Pausing/unpausing indexing and monitoring
- Checking service status
- Managing service lifecycle
This enables automation and integration with other systems.
Use Cases
Khedra excels in various blockchain data scenarios:
- Account Monitoring: Track transactions and interactions for specific addresses
- Index Building: Create comprehensive local blockchain indices
- Data Analysis: Extract on-chain patterns and insights
- Custom Applications: Build specialized tools using the REST API
- Research: Analyze blockchain data with complete privacy
Getting Started
The following sections will guide you through:
- Installing and configuring Khedra
- Understanding service management
- Using pause/unpause functionality
- Working with the REST API
- Maintenance and troubleshooting
Khedra provides the foundation for building powerful blockchain data applications while maintaining complete control over your data and privacy.
Getting Started
Quick Start
Get Khedra running in 3 simple steps:
1. Initialize Khedra
Run the configuration wizard to set up your blockchain connections and services:
khedra init
This interactive wizard will guide you through:
- Setting up blockchain RPC connections (Ethereum, Polygon, etc.)
- Configuring which services to enable (scraper, monitor, API, IPFS)
- Setting up logging and data storage paths
2. Start Khedra
Start all configured services:
khedra daemon
This starts the daemon with all enabled services. The Control Service runs automatically and manages other services.
3. Control Services
Once running, manage services through the CLI or REST API:
CLI Commands
# Pause/unpause services
khedra pause scraper
khedra unpause scraper
khedra pause all
khedra unpause all

# View configuration
khedra config show
REST API
# Check service status
curl http://localhost:8080/api/v1/services

# Start/stop individual services
curl -X POST http://localhost:8080/api/v1/services/scraper/start
curl -X POST http://localhost:8080/api/v1/services/monitor/stop

# Pause/unpause services via control API
curl -X POST "http://localhost:8338/pause?name=scraper"
curl -X POST "http://localhost:8338/unpause?name=scraper"

# Get system status
curl http://localhost:8080/api/v1/status
That's it! Your Khedra instance is now indexing blockchain data and ready for queries.
Detailed Configuration
Khedra runs primarily from a configuration file called config.yaml. This file lives at ~/.khedra/config.yaml by default. If the file is not found, Khedra creates a default configuration in this location.
The config file allows you to specify key parameters for running khedra, including which chains to index/monitor, which services to enable, how detailed to log the processes, and where and how to publish (that is, share) the results.
You may use environment variables to override specific options. This document outlines the configuration file structure, validation rules, default values, and environment variable usage.
Installation
-
Download, build, and test khedra:
git clone https://github.com/TrueBlocks/trueblocks-khedra.git
cd trueblocks-khedra
go build -o khedra main.go
./khedra version
You should get something similar to
khedra v4.0.0-release. -
You may edit the config file with:
./khedra config editModify the file according to your requirements (see below).
The minimal configuration needed is to provide a valid RPC to Ethereum mainnet. (All configurations require access to Ethereum
mainnet.)You may configure as many other EVM-compatible chains (each with its own RPC) as you like.
-
Use the Wizard:
You may also use the khedra wizard to create a configuration file. The wizard will prompt you for the required information and generate a
config.yamlfile../khedra init -
Location of the configuration file:
By default, the config file resides at
~/.khedra/config.yaml. (The folder and the file will be created if it does not exist).You may, however, place a
config.yamlfile in the current working folder (the folder from which you run khedra). If found locally, this configuration file will dominate. This allows for running multiple instances of the software concurrently.
Advanced Configuration Examples
Production Deployment Configuration
For production environments with high availability and performance requirements:
general:
  indexPath: "/var/lib/khedra/index"     # Fast SSD storage
  cachePath: "/var/lib/khedra/cache"     # Local SSD cache
  dataDir: "/var/lib/khedra"             # Dedicated data directory

chains:
  mainnet:
    rpcs:
      - "https://eth-mainnet.alchemyapi.io/v2/YOUR_PREMIUM_KEY"
      - "https://mainnet.infura.io/v3/YOUR_PROJECT_ID"
      - "https://rpc.ankr.com/eth"              # Fallback
      - "https://ethereum.publicnode.com"       # Additional fallback
    enabled: true

  polygon:
    rpcs:
      - "https://polygon-mainnet.g.alchemy.com/v2/YOUR_KEY"
      - "https://polygon-rpc.com"
    enabled: true

  arbitrum:
    rpcs:
      - "https://arb-mainnet.g.alchemy.com/v2/YOUR_KEY"
      - "https://arb1.arbitrum.io/rpc"
    enabled: true

services:
  scraper:
    enabled: true
    sleep: 5                     # Aggressive indexing
    batchSize: 2000             # Large batches for efficiency

  monitor:
    enabled: true
    sleep: 5                    # Fast monitoring
    batchSize: 500

  api:
    enabled: true
    port: 8080

  ipfs:
    enabled: true
    port: 8083

logging:
  folder: "/var/log/khedra"     # System log directory
  filename: "khedra.log"
  toFile: true                  # Always log to file in production
  level: "info"                 # Balanced logging
  maxSize: 100                  # Larger log files
  maxBackups: 10               # More backup files
  maxAge: 90                   # Longer retention
  compress: true               # Compress old logs
Multi-Chain Development Environment
For developers working with multiple blockchain networks:
general:
  indexPath: "~/.khedra/dev/index"
  cachePath: "~/.khedra/dev/cache"

chains:
  mainnet:
    rpcs:
      - "https://eth-mainnet.alchemyapi.io/v2/YOUR_DEV_KEY"
    enabled: true

  sepolia:
    rpcs:
      - "https://eth-sepolia.g.alchemy.com/v2/YOUR_KEY"
      - "https://sepolia.infura.io/v3/YOUR_PROJECT_ID"
    enabled: true

  polygon:
    rpcs:
      - "https://polygon-mumbai.g.alchemy.com/v2/YOUR_KEY"
    enabled: true

  optimism:
    rpcs:
      - "https://opt-goerli.g.alchemy.com/v2/YOUR_KEY"
    enabled: true

  arbitrum:
    rpcs:
      - "https://arb-goerli.g.alchemy.com/v2/YOUR_KEY"
    enabled: true

  base:
    rpcs:
      - "https://base-goerli.g.alchemy.com/v2/YOUR_KEY"
    enabled: true

services:
  scraper:
    enabled: true
    sleep: 15                   # Moderate speed for development
    batchSize: 500

  monitor:
    enabled: true               # Enable for testing monitoring features
    sleep: 30
    batchSize: 100

  api:
    enabled: true
    port: 8080

  ipfs:
    enabled: false              # Disable to reduce resource usage

logging:
  folder: "~/.khedra/dev/logs"
  filename: "khedra-dev.log"
  toFile: true
  level: "debug"               # Verbose logging for development
  maxSize: 10
  maxBackups: 5
  maxAge: 7                    # Shorter retention for dev
  compress: false              # No compression for easier reading
High-Availability Load-Balanced Setup
Configuration for running multiple Khedra instances behind a load balancer:
# Instance 1: Primary indexing node
general:
  indexPath: "/shared/khedra/index"      # Shared storage
  cachePath: "/local/khedra/cache1"      # Local cache per instance

chains:
  mainnet:
    rpcs:
      - "https://eth-mainnet-primary.alchemyapi.io/v2/KEY1"
      - "https://eth-mainnet-backup.infura.io/v3/PROJECT1"
    enabled: true

services:
  scraper:
    enabled: true              # Primary indexer
    sleep: 5
    batchSize: 2000

  monitor:
    enabled: false             # Disabled on indexing nodes

  api:
    enabled: false             # Dedicated API nodes

  ipfs:
    enabled: true              # IPFS on indexing nodes
    port: 8083

logging:
  folder: "/var/log/khedra"
  filename: "khedra-indexer-1.log"
  toFile: true
  level: "info"
---

# Instance 2: API-only node
general:
  indexPath: "/shared/khedra/index"      # Same shared storage
  cachePath: "/local/khedra/cache2"      # Different local cache

chains:
  mainnet:
    rpcs:
      - "https://eth-mainnet-api.alchemyapi.io/v2/KEY2"
    enabled: true

services:
  scraper:
    enabled: false             # No indexing on API nodes

  monitor:
    enabled: true              # Monitoring on API nodes
    sleep: 10
    batchSize: 200

  api:
    enabled: true              # Primary function
    port: 8080

  ipfs:
    enabled: false             # Not needed on API nodes

logging:
  folder: "/var/log/khedra"
  filename: "khedra-api-2.log"
  toFile: true
  level: "warn"               # Less verbose for API nodes
Resource-Constrained Environment
Configuration for running Khedra on limited hardware (VPS, Raspberry Pi, etc.):
general:
  indexPath: "~/.khedra/index"
  cachePath: "~/.khedra/cache"

chains:
  mainnet:
    rpcs:
      - "https://ethereum.publicnode.com"    # Free RPC
      - "https://rpc.ankr.com/eth"           # Backup free RPC
    enabled: true

  # Only enable additional chains if needed
  sepolia:
    rpcs:
      - "https://ethereum-sepolia.publicnode.com"
    enabled: false               # Disabled to save resources

services:
  scraper:
    enabled: true
    sleep: 60                   # Very conservative indexing
    batchSize: 50               # Small batches

  monitor:
    enabled: false              # Disable to save resources
    sleep: 300
    batchSize: 10

  api:
    enabled: true
    port: 8080

  ipfs:
    enabled: false              # Disable to save bandwidth/storage

logging:
  folder: "~/.khedra/logs"
  filename: "khedra.log"
  toFile: false                 # Console only to save disk space
  level: "warn"                # Minimal logging
  maxSize: 5                   # Small log files
  maxBackups: 2                # Minimal retention
  maxAge: 7
  compress: true
Security-Focused Configuration
Configuration with enhanced security for sensitive environments:
general:
  indexPath: "/encrypted/khedra/index"   # Encrypted storage
  cachePath: "/encrypted/khedra/cache"

chains:
  mainnet:
    rpcs:
      - "https://your-private-node.internal:8545"  # Private RPC node
    enabled: true

services:
  scraper:
    enabled: true
    sleep: 10
    batchSize: 1000

  monitor:
    enabled: true
    sleep: 15
    batchSize: 100

  api:
    enabled: true
    port: 8080                  # Consider using reverse proxy with TLS

  ipfs:
    enabled: false              # Disable external data sharing

logging:
  folder: "/secure/logs/khedra"
  filename: "khedra.log"
  toFile: true
  level: "info"
  maxSize: 50
  maxBackups: 20              # Extended retention for audit
  maxAge: 365                 # Long retention for compliance
  compress: true

# Environment variables for sensitive data:
# TB_KHEDRA_CHAINS_MAINNET_RPCS="https://user:pass@private-node:8545"
# TB_KHEDRA_API_AUTH_TOKEN="your-secure-api-token"
# TB_KHEDRA_WAIT_FOR_NODE="erigon"          # (Optional) Wait for node process before starting
# TB_KHEDRA_WAIT_SECONDS="60"              # (Optional) Wait time for node stabilization (default: 30)
Testing and CI/CD Configuration
Configuration optimized for automated testing environments:
general:
  indexPath: "./test-data/index"
  cachePath: "./test-data/cache"

chains:
  sepolia:                      # Use testnet for testing
    rpcs:
      - "https://ethereum-sepolia.publicnode.com"
    enabled: true

  mainnet:
    rpcs:
      - "https://ethereum.publicnode.com"
    enabled: false              # Disabled for testing

services:
  scraper:
    enabled: true
    sleep: 30                   # Conservative for CI resources
    batchSize: 100

  monitor:
    enabled: true               # Test monitoring functionality
    sleep: 60
    batchSize: 50

  api:
    enabled: true
    port: 8080

  ipfs:
    enabled: false              # Not needed for testing

logging:
  folder: "./test-logs"
  filename: "khedra-test.log"
  toFile: true
  level: "debug"               # Verbose for troubleshooting tests
  maxSize: 10
  maxBackups: 3
  maxAge: 1                    # Short retention for CI
  compress: false              # Easier to read in CI logs
Understanding Khedra
Core Concepts
The Unchained Index
The foundation of Khedra is the Unchained Index - a specialized data structure that maps blockchain addresses to their appearances in blockchain data. Think of it as a reverse index: while a blockchain explorer lets you look up a transaction and see which addresses were involved, the Unchained Index lets you look up an address and see all transactions where it appears.
The index captures appearances from multiple sources:
- External Transactions: Direct sends and receives
- Internal Transactions: Contract-to-contract calls (from traces)
- Event Logs: Events emitted by smart contracts
- State Changes: Modifications to contract storage
- Special Appearances: Block rewards, validators, etc.
What makes this particularly powerful is that the index includes trace-derived appearances - meaning it captures internal contract interactions that normal blockchain explorers miss.
Address Appearances
An "appearance" in Khedra means any instance where an address is referenced in blockchain data. Each appearance record contains:
- The address that appeared
- The block number where it appeared
- The transaction index within that block
- Additional metadata about the appearance type
These compact records allow Khedra to quickly answer the fundamental question: "Where does this address appear in the blockchain?"
Local-First Architecture
Khedra operates as a "local-first" application, meaning:
- All data processing happens on your local machine
- Your queries never leave your computer
- You maintain complete ownership of your data
- The application continues to work without internet access
This approach maximizes privacy and resilience while minimizing dependency on external services.
Distributed Collaboration
While Khedra is local-first, it also embraces distributed collaboration through IPFS integration:
- The Unchained Index can be shared and downloaded in chunks
- Users can contribute to different parts of the index
- New users can bootstrap quickly by downloading existing index portions
- The system becomes more resilient as more people participate
This creates a hybrid model that preserves privacy while enabling community benefits.
System Architecture
Service Components
Khedra is organized into five core services:
-
Control Service
- Provides minimal pause / unpause endpoints (
/pause,/unpause,/isPaused) - Does not (yet) implement start/stop/restart, health metrics, or runtime config changes
- Always started and not user‑pausable
- Provides minimal pause / unpause endpoints (
-
Scraper Service
- Processes blockchain data to build the Unchained Index
- Extracts address appearances from blocks, transactions, and traces
- Works in configurable batches with adjustable sleep intervals
-
Monitor Service
- Tracks specific addresses of interest
- Provides notifications for address activities
- Maintains focused indices for monitored addresses
-
API Service
- Exposes data through REST endpoints (defined here: API Docs)
- Provides query interfaces for the index and monitors
- Enables integration with other tools and services
-
IPFS Service
- Facilitates distributed sharing of index data
- Handles publishing and retrieving chunks via IPFS
- Enables collaborative index building
Data Flow and Service Interactions
Here's how data flows through the Khedra system and how services interact:
graph TD
    A[RPC Endpoints] --> B[Scraper Service]
    B --> C[Unchained Index]
    B --> D[IPFS Service]
    C --> E[API Service]
    C --> F[Monitor Service]
    G[Control Service] --> B
    G --> F
    G --> E
    G --> D
    E --> H[External Applications]
    F --> I[Address Notifications]
    D --> J[IPFS Network]

    style G fill:#ff9999
    style B fill:#99ccff
    style F fill:#99ffcc
    style E fill:#ffcc99
    style D fill:#cc99ff
Detailed Service Interactions
-
Control Service (Central Hub)
- Manages lifecycle of all other services
- Coordinates startup/shutdown sequences
- Monitors health and performance of all services
- Provides management API accessible to external tools
-
Data Processing Flow:
- Scraper retrieves blockchain data from RPC endpoints
- Address appearances are extracted and stored in the Unchained Index
- Monitor service checks new blocks against watched address lists
- API service provides query access to indexed data
- IPFS service optionally shares index chunks with the network
-
Service Dependencies:
- Monitor depends on Scraper for real-time block data
- API depends on Unchained Index created by Scraper
- IPFS can operate independently but enhances Scraper functionality
- All services depend on Control service for management operations
Independent vs Coordinated Services
Services that can run independently:
- API Service: Can serve existing index data without other services
- IPFS Service: Can share/retrieve data independently of indexing
- Control Service: Always runs and manages others
Services that work better together:
- Scraper + Monitor: Monitor gets real-time data from Scraper
- Scraper + IPFS: IPFS can automatically share new index chunks
- Scraper + API: API serves fresh data as Scraper creates it
Service Startup Order
Current code starts Control first, then iterates over the configured services map (Go map iteration order is not guaranteed). There is no enforced dependency sequence beyond Control being available.
Using Khedra
This chapter covers the practical aspects of working with Khedra for blockchain data indexing and monitoring.
Command Overview
Khedra provides five essential commands:
NAME:
   khedra - A tool to index, monitor, serve, and share blockchain data

USAGE:
   khedra [global options] command [command options]

COMMANDS:
   init     Initializes Khedra configuration
   daemon   Runs Khedra's services
   config   Manages Khedra configuration
   pause    Pause services (scraper, monitor, all)
   unpause  Unpause services (scraper, monitor, all)
   help, h  Shows help for commands

GLOBAL OPTIONS:
   --help, -h     show help
   --version, -v  print the version
Getting Started
1. Initialize Configuration
Set up Khedra's configuration interactively:
khedra init
The initialization wizard configures:
- General Settings: Data directories, logging preferences
- Chain Configuration: RPC endpoints for blockchain networks
- Service Settings: Which services to enable (scraper, monitor, API, IPFS)
- Port Configuration: Network ports for HTTP services
2. Start Services
Launch all configured services:
khedra daemon
This starts Control first and then any enabled services (scraper, monitor, api, ipfs) in an internal map iteration order (not guaranteed). The daemon runs until interrupted (Ctrl+C) or SIGTERM.
3. Manage Configuration
View or edit configuration:
# Display current configuration
khedra config show

# Edit configuration in default editor
khedra config edit
Changes require restarting the daemon to take effect.
Service Management
Control individual services at runtime without stopping the daemon:
Pause Services
Temporarily stop service operations:
# Pause specific services
khedra pause scraper    # Stop blockchain indexing
khedra pause monitor    # Stop address monitoring

# Pause all pausable services
khedra pause all
Resume Services
Restart paused services:
# Resume specific services
khedra unpause scraper
khedra unpause monitor

# Resume all paused services
khedra unpause all
Service Types
Pausable Services:
scraper: Can be paused to stop indexingmonitor: Can be paused to stop address monitoring
Always-On Services:
control: Provides service management APIapi: Serves data queries (cannot be paused)ipfs: Handles distributed sharing (cannot be paused)
REST API Control
The Control service (first open of 8338, 8337, 8336, 8335) provides minimal HTTP endpoints for automation:
Check Service Status
# All service status
curl "http://localhost:8338/isPaused"

# Specific service status
curl "http://localhost:8338/isPaused?name=scraper"
Response format:
[
  {"name": "scraper", "status": "running"},
  {"name": "monitor", "status": "paused"},
  {"name": "control", "status": "not pausable"}
]
Control Operations
# Pause services (currently implemented as GET requests)
curl "http://localhost:8338/pause?name=scraper"
curl "http://localhost:8338/pause?name=all"

# Resume services
curl "http://localhost:8338/unpause?name=scraper"
curl "http://localhost:8338/unpause?name=all"
Common Workflows
Initial Setup
- Install: Build or install Khedra binary
- Initialize: Run
khedra initto configure - Start: Run
khedra daemonto begin indexing - Monitor: Use pause/unpause for operational control
Operational Management
# Check what's running
curl "http://localhost:8338/isPaused"

# Pause indexing during maintenance
khedra pause scraper

# Resume normal operations
khedra unpause scraper

# Pause everything for system maintenance
khedra pause all
khedra unpause all
Configuration Updates
# View current settings
khedra config show

# Edit configuration
khedra config edit

# Restart to apply changes
# (Stop daemon with Ctrl+C, then restart)
khedra daemon
Environment Variables
Control behavior with environment variables:
TB_KHEDRA_WAIT_FOR_NODE: Wait for specific node process (e.g.,erigon,geth)TB_KHEDRA_WAIT_SECONDS: Seconds to wait after node detection (default: 30)TB_KHEDRA_LOGGING_LEVEL: Log verbosity (debug,info,warn,error)EDITOR: Editor forconfig editcommand
Example:
TB_KHEDRA_LOGGING_LEVEL=debug khedra daemon
Troubleshooting
Common Issues
Configuration not found: Run khedra init to create initial configuration
Port conflicts: Control service picks first free port from 8338 → 8335
Service not pausable: Only scraper and monitor services can be paused
Control API unavailable: Ensure daemon is running and control service is enabled
Getting Help
# Command-specific help
khedra init --help
khedra daemon --help
khedra pause --help

# General help
khedra --help

# Version information
khedra --version
Debug Information
Enable verbose logging:
TB_KHEDRA_LOGGING_LEVEL=debug khedra daemon
Check service status via API:
curl "http://localhost:8338/isPaused" | jq
Monitor log output for service-specific issues and configuration problems.
Troubleshooting
This chapter covers routine maintenance tasks and solutions to common issues you might encounter when using Khedra.
Routine Maintenance
Regular Updates
To keep Khedra running smoothly, periodically check for and install updates:
# Check current version
khedra version

# Update to the latest version
go get -u github.com/TrueBlocks/trueblocks-khedra/v6

# Rebuild and install
cd <path_for_khedra_github_repo>
git pull --recurse-submodules
go build -o bin/khedra main.go
./bin/khedra version
Log Rotation
Khedra automatically rotates logs based on your configuration, but you should periodically check log usage:
# Check log directory size
du -sh ~/.khedra/logs

# List log files
ls -la ~/.khedra/logs
If logs are consuming too much space, adjust your logging configuration:
logging:
  maxSize: 10      # Maximum size in MB before rotation
  maxBackups: 5    # Number of rotated files to keep
  maxAge: 30       # Days to keep rotated logs
  compress: true   # Compress rotated logs
Index Verification
Periodically verify the integrity of your Unchained Index:
chifra chunks index --check --chain <chain_name>
This checks for any gaps or inconsistencies in the index and reports issues.
Cache Management
You may check on the cache size and prune old caches (by hand) to free up space:
# Check cache size
chifra status --verbose
Troubleshooting
Common Issues and Solutions
Service Won't Start
Symptoms: A service fails to start or immediately stops.
Solutions:
-
Check the logs for error messages:
tail -n 100 ~/.khedra/logs/khedra.log -
Verify the service's port isn't in use by another application:
lsof -i :<port_number> -
Ensure the RPC endpoints are accessible:
chifra status -
Try starting with verbose logging:
TB_KHEDRA_LOGGING_LEVEL=debug TB_KHEDRA_LOGGING_TOFILE=true khedra start
Service Management Issues
Symptoms: Unable to pause/unpause services or service management commands fail.
Solutions:
-
Service Not Found Error:
# Verify service is enabled and running khedra config show | grep -A5 services # Check which services are actually running curl http://localhost:8338/is-paused -
Service Not Pausable:
# Only scraper and monitor can be paused # These services cannot be paused: control, api, ipfs khedra pause scraper # ✓ Works khedra pause api # ✗ Not pausable -
Control Service Not Responding:
# Check if control service is running on expected port curl http://localhost:8338/status # Verify khedra daemon is running ps aux | grep khedra -
Pause State Not Persisting:
# Note: Pause state is not saved to configuration
# Services return to unpaused state after restart
# This is expected behavior
Service-Specific Troubleshooting
Scraper Service Issues
Symptoms: Scraper service fails to start, stops unexpectedly, or indexes slowly.
Common Issues and Solutions:
-
RPC Connection Failures:
# Test RPC connectivity curl -X POST -H "Content-Type: application/json" \ --data '{"jsonrpc":"2.0","method":"eth_blockNumber","params":[],"id":1}' \ http://your-rpc-endpoint # Check RPC provider limits grep -i "rate limit\|too many requests" ~/.khedra/logs/khedra.log -
Batch Size Optimization:
# For fast RPC endpoints services: scraper: batchSize: 2000 sleep: 5 # For slower/limited RPC endpoints services: scraper: batchSize: 100 sleep: 30 -
Memory Issues:
# Monitor scraper memory usage ps -o pid,vsz,rss,comm -p $(pgrep -f "scraper") # Reduce batch size if memory usage is high -
Scraper-Specific Log Analysis:
# Filter scraper logs
grep "scraper" ~/.khedra/logs/khedra.log | tail -50

# Look for specific errors
grep -E "error|failed|timeout" ~/.khedra/logs/khedra.log | grep scraper
Monitor Service Issues
Symptoms: Monitor service doesn't detect address activity or sends duplicate notifications.
Common Issues and Solutions:
-
No Monitored Addresses:
# Check if addresses are properly configured chifra list --monitors # Add addresses to monitor chifra monitors --addrs 0x742d35Cc6634C0532925a3b844Bc454e4438f44e -
Monitor Service Dependencies:
# Ensure scraper is running for real-time monitoring curl http://localhost:8080/api/v1/services/scraper # Check if index is up to date chifra status --index -
Monitor Configuration Issues:
services: monitor: enabled: true sleep: 12 # Check every 12 seconds batchSize: 100 # Process 100 addresses at once -
Monitor-Specific Logs:
# Filter monitor logs
grep "monitor" ~/.khedra/logs/khedra.log | tail -50

# Check for address activity detection
grep -i "activity\|appearance" ~/.khedra/logs/khedra.log
API Service Issues
Symptoms: API service returns errors, timeouts, or incorrect data.
Common Issues and Solutions:
-
Port Conflicts:
# Check if API port is available lsof -i :8080 # Change API port if needed export TB_KHEDRA_SERVICES_API_PORT=8081 -
API Performance Issues:
# Test API response time time curl http://localhost:8080/status # Check for slow queries grep -E "slow|timeout" ~/.khedra/logs/khedra.log | grep api -
API Authentication Issues:
# Verify API is accessible curl -v http://localhost:8080/api/v1/services # Check for auth-related errors grep -i "auth\|unauthorized" ~/.khedra/logs/khedra.log -
Data Consistency Issues:
# Compare API data with direct index queries
chifra list 0x742d35Cc6634C0532925a3b844Bc454e4438f44e
curl http://localhost:8080/api/v1/list/0x742d35Cc6634C0532925a3b844Bc454e4438f44e
IPFS Service Issues
Symptoms: IPFS service fails to start, can't connect to network, or sharing fails.
Common Issues and Solutions:
-
IPFS Daemon Issues:
# Check IPFS daemon status ps aux | grep ipfs # Restart IPFS if needed curl -X POST http://localhost:8080/api/v1/services/ipfs/restart -
IPFS Port Conflicts:
# Check IPFS ports lsof -i :5001 # IPFS API port lsof -i :4001 # IPFS swarm port # Configure different IPFS port export TB_KHEDRA_SERVICES_IPFS_PORT=5002 -
IPFS Network Connectivity:
# Test IPFS connectivity curl http://localhost:5001/api/v0/id # Check peer connections curl http://localhost:5001/api/v0/swarm/peers -
Index Sharing Issues:
# Check IPFS pinning status
curl http://localhost:5001/api/v0/pin/ls

# Verify index chunk uploads
grep -i "ipfs\|pin" ~/.khedra/logs/khedra.log
Control Service Issues
Symptoms: Cannot manage other services via API or CLI commands fail.
Common Issues and Solutions:
-
Control Service Availability:
# Verify control service is running curl http://localhost:8080/api/v1/services # Check control service logs grep "control" ~/.khedra/logs/khedra.log -
Service Management Failures:
# Test individual service control curl -X POST http://localhost:8080/api/v1/services/scraper/status # Check for permission issues grep -i "permission\|access denied" ~/.khedra/logs/khedra.log -
Configuration Issues:
# Verify control service configuration
khedra config show | grep -A5 -B5 control

# Test configuration validation
khedra config validate
Log Analysis
Khedra's logs are your best resource for troubleshooting. Here's how to use them effectively:
# View recent log entries
tail -f ~/.khedra/logs/khedra.log

# Search for error messages
grep -i error ~/.khedra/logs/khedra.log

# Find logs related to a specific service
grep "scraper" ~/.khedra/logs/khedra.log

# Find logs related to a specific address
grep "0x742d35Cc6634C0532925a3b844Bc454e4438f44e" ~/.khedra/logs/khedra.log
Getting Help
If you encounter issues you can't resolve:
- Check the Khedra GitHub repository for known issues
- Search the discussions forum for similar problems
- Submit a detailed issue report including:
- Khedra version (
khedra version) - Relevant log extracts
- Steps to reproduce the problem
- Your configuration (with sensitive data redacted)
- Khedra version (
Regular maintenance and prompt troubleshooting will keep your Khedra installation running smoothly and efficiently.
Implementation Details
The maintenance and troubleshooting procedures described in this document are implemented in several key files:
Service Management
- Service Lifecycle Management:
app/action_daemon.go- Contains the core service management code that starts, stops, and monitors services - Service Health Checks: Service status monitoring is implemented in the daemon action function
RPC Connection Management
- RPC Endpoint Testing:
pkg/validate/try_connect.go- Contains theTestRpcEndpointfunction used to verify endpoints are functioning correctly - RPC Validation:
app/has_valid_rpc.go- Implements validation logic for RPC endpoints
Logging System
- Log Configuration: Defined in the
Loggingstruct inpkg/types/general.gowhich handles log rotation and management - Logger Implementation: Custom logger in
pkg/types/custom_logger.gothat provides structured logging capabilities
Error Recovery
The troubleshooting techniques described are supported by robust error handling throughout the codebase, especially in:
- Service error handling: Found in the daemon action function
- Validation error reporting: Implemented in the validation framework
- Index management functions: For identifying and fixing gaps in the index
Technical Specification
Purpose of this Document
This document defines the technical architecture, design, and functionalities of Khedra, enabling developers and engineers to understand its internal workings and design principles. For a less technical overview of the application, refer to the User Manual.
Intended Audience
This specification is for:
- Developers working on Khedra or integrating it into applications.
- System architects designing systems that use Khedra.
- Technical professionals looking for a detailed understanding of the system.
Scope and Objectives
The specification covers:
- High-level architecture.
- Core functionalities such as blockchain indexing, REST API, and address monitoring.
- Design principles, including scalability, error handling, and integration with IPFS.
- Supported chains, RPC requirements, and testing methodologies.
System Overview
Khedra is a sophisticated blockchain indexing and monitoring solution designed with a local-first architecture. It creates and maintains the Unchained Index - a permissionless index of address appearances across blockchain data - enabling powerful monitoring capabilities for any address on any supported EVM-compatible chain.
Core Technical Components
- Indexing Engine: Processes blockchain data to extract and store address appearances
- Service Framework: Manages the lifecycle of modular services (scraper, monitor, API, IPFS, control)
- Data Storage Layer: Organizes and persists index data and caches
- Configuration System: Manages user preferences and system settings
- API Layer: Provides programmatic access to indexed data
Key Design Principles
Khedra's technical design adheres to several foundational principles:
- Local-First Processing: All data processing happens on the user's machine, maximizing privacy
- Chain Agnosticism: Support for any EVM-compatible blockchain with minimal configuration
- Modularity: Clean separation of concerns between services for flexibility and maintainability
- Resource Efficiency: Careful management of system resources, especially during indexing
- Resilience: Robust error handling and recovery mechanisms
- Extensibility: Interfaces intended to allow additional components without refactoring core code
Technology Stack
Khedra is built on a modern technology stack:
- Go: The primary implementation language, chosen for its performance, concurrency model, and cross-platform support
- IPFS: For distributed sharing of index data
- RESTful API: For service integration and data access
- YAML: For configuration management
- Structured Logging: For operational monitoring and debugging
Target Audience
This technical specification is intended for:
- Developers: Contributing to Khedra or building on top of it
- System Administrators: Deploying and maintaining Khedra instances
- Technical Architects: Evaluating Khedra for integration with other systems
- Advanced Users: Seeking a deeper understanding of how Khedra works
Document Structure
The remaining sections of this specification are organized as follows:
- System Architecture: The high-level structure and components
- Core Functionalities: Detailed explanations of key features
- Technical Design: Implementation details and design patterns
- Supported Chains: Technical requirements and integration details
- Command-Line Interface: API and usage patterns
- Performance and Scalability: Benchmarks and optimization strategies
- Integration Points: APIs and interfaces for external systems
- Testing and Validation: Approaches to quality assurance
- Appendices: Technical reference materials
This specification aims to provide a comprehensive understanding of Khedra's technical aspects while serving as a reference for implementation, maintenance, and extension of the system.
System Architecture
Architectural Overview
Khedra employs a modular, service-oriented architecture. A central application core wires up a set of specialized services, each with a narrow responsibility.
High-Level Architecture Diagram
┌─────────────────────────────────────────────────────────────────┐
│                      Khedra Application                          │
├─────────┬─────────┬─────────┬─────────┬─────────────────────────┤
│ Control │ Scraper │ Monitor │   API   │         IPFS            │
│ Service │ Service │ Service │ Service │        Service          │
├─────────┴─────────┴─────────┴─────────┴─────────────────────────┤
│                      Configuration Manager                       │
├─────────────────────────────────────────────────────────────────┤
│                          Data Layer                              │
│  ┌──────────┐  ┌──────────┐  ┌──────────┐  ┌──────────────────┐ │
│  │ Unchained│  │  Binary  │  │ Monitor  │  │ Chain-Specific   │ │
│  │   Index  │  │  Caches  │  │   Data   │  │     Data         │ │
│  └──────────┘  └──────────┘  └──────────┘  └──────────────────┘ │
├─────────────────────────────────────────────────────────────────┤
│                      Blockchain Connectors                       │
└─────────────────────────────────────────────────────────────────┘
             ▲                    ▲                     ▲
             │                    │                     │
 ┌───────────┴──────────┐ ┌──────┴───────┐  ┌──────────┴──────────┐
 │  Ethereum Mainnet    │ │   Testnets   │  │   Other EVM Chains  │
 └──────────────────────┘ └──────────────┘  └─────────────────────┘
Core Components
1. Khedra Application
The main application container initializes configuration and wires up the enabled services. Today it provides:
- Basic service instantiation (no dynamic registration at runtime)
- One–time startup (no hot restart orchestration)
- OS signal handling for shutdown via the underlying service manager
There is no cross‑service message bus, restart policy, or runtime dependency graph.
Implementation: app/app.go, app/action_daemon.go
2. Service Framework
Khedra implements five primary services:
2.1 Control Service
Current (implemented) responsibilities:
- Exposes a minimal HTTP interface for pausing / unpausing pausable services
- Reports simple paused / running / not‑pausable status via
/isPaused - Listens on the first available port in the range 8338–8335
Not implemented: start/stop/restart of individual services, runtime configuration mutation, health or metrics aggregation, dependency ordering logic, automatic restarts, or a generalized management API surface.
Implementation entry: constructed in app/action_daemon.go (via services.NewControlService).
2.2 Scraper Service
Intended role (some functionality provided by the upstream SDK library):
- Processes blockchain data in batches (batch size & sleep interval configurable in
config.yaml) - Capable of being paused / unpaused through the Control Service endpoints
Detailed index storage, retry semantics, and appearance extraction logic live in the shared TrueBlocks SDK (not in this repository) and are therefore abstracted from this codebase. Paths: created through services.NewScrapeService in app/action_daemon.go.
2.3 Monitor Service
Current state:
- Instantiated when enabled but disabled by default
- Supports pause / unpause
- Advanced notification / registry features are not implemented here.
Implementation entry: created via services.NewMonitorService in app/action_daemon.go.
2.4 API Service
When enabled it exposes HTTP endpoints (details provided by the SDK). This repository does not implement authentication, rate limiting, Swagger generation, or multi‑format response logic.
Implementation entry: services.NewApiService in app/action_daemon.go.
2.5 IPFS Service
Optional. Created only if enabled. Within this codebase we only instantiate via services.NewIpfsService.
3. Configuration Manager
Implemented as a YAML backed configuration (~/.khedra/config.yaml by default) created / edited through the init wizard or khedra config edit. Runtime (hot) reconfiguration is not supported; changes require a daemon restart.
Implementation: pkg/types/config.go and related helpers in app/.
4. Data Layer
The persistent storage infrastructure for Khedra:
4.1 Unchained Index
- Core data structure mapping addresses to appearances
- Optimized for fast lookups and efficient storage
- Implements chunking for distributed sharing
- Includes versioning for format compatibility
Implementation: pkg/index/index.go
4.2 Binary Caches
- Stores raw blockchain data for efficient reprocessing
- Implements cache invalidation and management
- Optimizes storage space usage with compression
- Supports pruning and maintenance operations
Implementation: pkg/cache/cache.go
4.3 Monitor Data
- Stores monitor definitions and state
- Tracks monitored address appearances
- Maintains notification history
- Implements efficient storage for frequent updates
Implementation: pkg/monitor/data.go
4.4 Chain-Specific Data
- Segregates data by blockchain
- Stores chain metadata and state
- Manages chain-specific configurations
- Handles chain reorganizations
Implementation: pkg/chains/data.go
5. Blockchain Connectors
Low‑level RPC client logic is handled in upstream TrueBlocks components; this repository primarily validates configured RPC endpoints (see HasValidRpc usage in app/action_daemon.go).
Communication Patterns
Khedra employs several communication patterns between components:
- RPC Communication: JSON-RPC communication with blockchain nodes (through upstream SDK)
- Minimal Control HTTP:
/isPaused,/pause,/unpauseendpoints for operational control - File-Based Storage: Index / cache paths determined by config (actual index logic external)
Deployment Architecture
Khedra supports multiple deployment models:
- Standalone Application: Single-process deployment
- (Removed) Prior Docker support has been removed (see project README)
Security Notes (Current Scope)
Current implementation is local‑first and depends on the operator to secure the host machine. Features such as authenticated API access, update integrity verification, and formal resource isolation are not implemented in this repository.
Core Functionalities
This section details Khedra's primary technical functionalities, explaining how each core feature is implemented and the technical approaches used.
Control Service
Service Management Interface
The Control Service exposes a minimal HTTP interface for pausing and unpausing supported services (scraper, monitor) and for reporting their pause status.
Technical Implementation
Implemented functions:
- Pause a pausable service
- Unpause a pausable service
- Report paused / running status
Scope: does not provide start/stop/restart, runtime config mutation, or metrics collection.
// Simplified Control Service interface
type ControlService struct {
    serviceManager *ServiceManager
    httpServer     *http.Server
    logger         *slog.Logger
}

type ServiceStatus struct {
    Name        string
    State       ServiceState
    LastStarted time.Time
    Uptime      time.Duration
    Metrics     map[string]interface{}
}

type ServiceState int
const (
    StateStopped ServiceState = iota
    StateStarting
    StateRunning
    StatePausing
    StatePaused
    StateStopping
)
Management Endpoints (Implemented)
GET /isPaused— status for all servicesGET /isPaused?name={service}— status for one serviceGET /pause?name={service|all}— pause service(s)GET /unpause?name={service|all}— unpause service(s)
Mutating operations currently use GET.
Pausable Services
Only services implementing the Pauser interface can be paused:
- Scraper: Blockchain indexing service (pausable)
- Monitor: Address monitoring service (pausable)
Non‑pausable services: control, api, ipfs (if enabled). The monitor service is disabled by default but is pausable when enabled.
Service Coordination
Coordination is limited to toggling internal paused state.
Blockchain Indexing
The Unchained Index (High-Level Overview)
The Unchained Index implementation resides in upstream TrueBlocks libraries. This repository configures and invokes indexing.
Technical Implementation
The index is implemented as a specialized data structure with these key characteristics:
- Bloom Filter Front-End: A probabilistic data structure that quickly determines if an address might appear in a block
- Address-to-Appearance Mapping: Maps each address to a list of its appearances
- Chunked Storage: Divides the index into manageable chunks (typically 1,000,000 blocks per chunk)
- Versioned Format: Includes version metadata to handle format evolution
Internal storage specifics are handled upstream and not duplicated here.
Indexing Process (Conceptual)
High level only: batches of blocks are processed, appearances extracted, and persisted through the underlying TrueBlocks indexing subsystem; batch size and sleep are configured in config.yaml.
Performance Optimizations
- Parallel Processing: Multiple blocks processed concurrently
- Bloom Filters: Fast negative lookups to avoid unnecessary disk access
- Binary Encoding: Compact storage format for index data
- Caching: Frequently accessed index portions kept in memory
Address Monitoring (Experimental / Limited)
Monitor Implementation
The monitoring system currently provides service enablement/disablement and pause control; advanced notification features are outside this repository.
Technical Implementation
Monitors are implemented using these components:
- Monitor Registry: Central store of all monitored addresses
- Address Index: Fast lookup structure for monitored addresses
- Activity Tracker: Records and timestamps address activity
- Notification Manager: Handles alert distribution based on configuration
Implementation structs are managed upstream.
Monitoring Process
- Registration: Add addresses to the monitor registry
- Block Processing: As new blocks are processed, check for monitored addresses
- Activity Detection: When a monitored address appears, record the activity
- Notification: Based on configuration, send notifications via configured channels
- State Update: Update the monitor's state with the new activity
Optimization Approaches
Optimizations will be added over time as needed.
API Service (When Enabled)
RESTful Interface
The API service provides HTTP endpoints for querying indexed data and managing Khedra's operations.
Technical Implementation
The API is implemented using these components:
- HTTP Server: Handles incoming requests and routing
- Route Handlers: Process specific endpoint requests
- Authentication Middleware: Optional API key verification
- Response Formatter: Structures data in requested format (JSON, CSV, etc.)
- Documentation: Auto-generated Swagger documentation
Server implementation is provided by upstream services packages.
API Endpoints
The API provides endpoints in several categories:
- Status Endpoints: System and service status information
- Index Endpoints: Query the Unchained Index for address appearances
- Monitor Endpoints: Manage and query address monitors
- Chain Endpoints: Blockchain information and operations
- Admin Endpoints: Configuration and management operations
Performance Considerations
- Connection Pooling: Reuse connections for efficiency
- Response Caching: Cache frequent queries with appropriate invalidation
- Pagination: Limit response sizes for large result sets
- Query Optimization: Efficient translation of API queries to index lookups
- Rate Limiting: Prevent resource exhaustion from excessive requests
IPFS Integration (Optional)
Distributed Index Sharing
The IPFS integration enables sharing and retrieving index chunks through the distributed IPFS network.
Technical Implementation
The IPFS functionality is implemented with these components:
- IPFS Node: Either embedded or external IPFS node connection
- Chunk Manager: Handles breaking the index into shareable chunks
- Publishing Logic: Manages uploading chunks to IPFS
- Discovery Service: Finds and retrieves chunks from the network
- Validation: Verifies the integrity of downloaded chunks
Implementation details are abstracted via the services layer.
Distribution Process
- Chunking: Divide the index into manageable chunks with metadata
- Publishing: Add chunks to IPFS and record their content identifiers (CIDs)
- Announcement: Share availability information through the network
- Discovery: Find chunks needed by querying the IPFS network
- Retrieval: Download needed chunks from peers
- Validation: Verify chunk integrity before integration
Optimization Strategies
- Incremental Updates: Share only changed or new chunks
- Prioritized Retrieval: Download most useful chunks first
- Peer Selection: Connect to reliable peers for better performance
- Background Syncing: Retrieve chunks in the background without blocking
- Compressed Storage: Minimize bandwidth and storage requirements
Configuration Management (YAML)
Flexible Configuration System
Khedra's configuration system provides multiple ways to configure the application, with clear precedence rules.
Technical Implementation
The configuration system is implemented with these components:
- YAML Parser: Reads the configuration file format
- Environment Variable Processor: Overrides from environment variables
- Validation Engine: Ensures configuration values are valid
- Defaults Manager: Provides sensible defaults where needed
- Runtime Updater: Handles configuration changes during operation
Authoritative structure lives in pkg/types/config.go.
Configuration Sources
The system processes configuration from these sources, in order of precedence:
- Environment Variables: Highest precedence, override all other sources
- Configuration File: User-provided settings in YAML format
- Default Values: Built-in defaults for unspecified settings
Validation Rules
The configuration system enforces these kinds of validation:
- Type Validation: Ensures values have the correct data type
- Range Validation: Numeric values within acceptable ranges
- Format Validation: Strings matching required patterns (e.g., URLs)
- Dependency Validation: Related settings are consistent
- Resource Validation: Settings are compatible with available resources
The descriptions above match the repository's current functionality.
Technical Design
This section details the key technical design decisions, patterns, and implementation approaches used in Khedra.
Code Organization
Khedra follows a modular code organization pattern to promote maintainability and separation of concerns.
Directory Structure
khedra/
├── app/                 // Application core
│   ├── khedra.go        // Main application definition
│   └── commands/        // CLI command implementations
├── cmd/                 // Command line entry points
│   └── khedra/          // Main CLI command
├── pkg/                 // Core packages
│   ├── config/          // Configuration management
│   ├── services/        // Service implementations
│   │   ├── api/         // API service
│   │   ├── control/     // Control service
│   │   ├── ipfs/        // IPFS service
│   │   ├── monitor/     // Monitor service
│   │   └── scraper/     // Scraper service
│   ├── index/           // Unchained Index implementation
│   ├── cache/           // Caching logic
│   ├── chains/          // Chain-specific code
│   ├── rpc/             // RPC client implementations
│   ├── wizard/          // Configuration wizard
│   └── utils/           // Shared utilities
└── main.go              // Application entry point
Package Design Principles
- Clear Responsibilities: Each package has a single, well-defined responsibility
- Minimal Dependencies: Packages depend only on what they need
- Interface-Based Design: Dependencies defined as interfaces, not concrete types
- Internal Encapsulation: Implementation details hidden behind public interfaces
- Context-Based Operations: Functions accept context for cancellation and timeout
Service Architecture
Khedra implements a service-oriented architecture within a single application.
Service Interface
Each service implements a common interface:
type Service interface {
    // Initialize the service
    Init(ctx context.Context) error

    // Start the service
    Start(ctx context.Context) error

    // Stop the service
    Stop(ctx context.Context) error

    // Return the service name
    Name() string

    // Return the service status
    Status() ServiceStatus

    // Return service-specific metrics
    Metrics() map[string]interface{}
}
Service Lifecycle
- Registration: Services register with the application core
- Initialization: Services initialize resources and validate configuration
- Starting: Services begin operations in coordinated sequence
- Running: Services perform their core functions
- Stopping: Services gracefully terminate when requested
- Cleanup: Services release resources during application shutdown
Service Coordination
Services coordinate through several mechanisms:
- Direct References: Services can hold references to other services when needed
- Event Bus: Publish-subscribe pattern for decoupled communication
- Shared State: Limited shared state for cross-service information
- Context Propagation: Request context flows through service operations
Data Storage Design
Khedra employs a hybrid storage approach for different data types.
Directory Layout
~/.khedra/
├── config.yaml           // Main configuration file
├── data/                 // Main data directory
│   ├── mainnet/          // Chain-specific data
│   │   ├── cache/        // Binary caches
│   │   │   ├── blocks/   // Cached blocks
│   │   │   ├── traces/   // Cached traces
│   │   │   └── receipts/ // Cached receipts
│   │   ├── index/        // Unchained Index chunks
│   │   └── monitors/     // Address monitor data
│   └── [other-chains]/   // Other chain data
└── logs/                 // Application logs
Storage Formats
- Index Data: Custom binary format optimized for size and query speed
- Cache Data: Compressed binary representation of blockchain data
- Monitor Data: Structured JSON for flexibility and human readability
- Configuration: YAML for readability and easy editing
- Logs: Structured JSON for machine processing and analysis
Storage Persistence Strategy
- Atomic Writes: Prevent corruption during unexpected shutdowns
- Version Headers: Include format version for backward compatibility
- Checksums: Verify data integrity through hash validation
- Backup Points: Periodic snapshots for recovery
- Incremental Updates: Minimize disk writes for frequently changed data
Error Handling and Resilience
Khedra implements robust error handling to ensure reliability in various failure scenarios.
Error Categories
- Transient Errors: Temporary failures that can be retried (network issues, rate limiting)
- Persistent Errors: Failures requiring intervention (misconfiguration, permission issues)
- Fatal Errors: Unrecoverable errors requiring application restart
- Validation Errors: Issues with user input or configuration
- Resource Errors: Problems with system resources (disk space, memory)
Resilience Patterns
- Retry with Backoff: Exponential backoff for transient failures
- Circuit Breakers: Prevent cascading failures when services are unhealthy
- Graceful Degradation: Reduce functionality rather than failing completely
- Health Checks: Proactive monitoring of dependent services
- Recovery Points: Maintain state that allows resuming after failures
Error Reporting
- Structured Logging: Detailed error information in structured format
- Context Preservation: Include context when errors cross boundaries
- Error Wrapping: Maintain error chains without losing information
- User-Friendly Messages: Translate technical errors to actionable information
- Error Metrics: Track error rates and patterns for analysis
Concurrency Model
Khedra leverages Go's concurrency primitives for efficient parallel processing.
Concurrency Patterns
- Worker Pools: Process batches of blocks concurrently with controlled parallelism
- Fan-Out/Fan-In: Distribute work to multiple goroutines and collect results
- Pipelines: Connect processing stages with channels for streaming data
- Context Propagation: Pass cancellation signals through processing chains
- Rate Limiting: Control resource usage and external API calls
Resource Management
- Connection Pooling: Reuse network connections to blockchain nodes
- Goroutine Limiting: Prevent excessive goroutine creation
- Memory Budgeting: Control memory usage during large operations
- I/O Throttling: Balance disk operations to prevent saturation
- Adaptive Concurrency: Adjust parallelism based on system capabilities
Synchronization Techniques
- Mutexes: Protect shared data structures from concurrent access
- Read/Write Locks: Optimize for read-heavy access patterns
- Atomic Operations: Use atomic primitives for simple counters and flags
- Channels: Communicate between goroutines and implement synchronization
- WaitGroups: Coordinate completion of multiple goroutines
Configuration Wizard
The configuration wizard provides an interactive interface for setting up Khedra.
Wizard Architecture
- Screen-Based Flow: Organized as a sequence of screens
- Question Framework: Standardized interface for user input
- Validation Layer: Real-time validation of user inputs
- Navigation System: Forward/backward movement between screens
- Help Integration: Contextual help for each configuration option
User Interface Design
- Text-Based UI: Terminal-friendly interface with box drawing
- Color Coding: Visual cues for different types of information
- Navigation Bar: Consistent display of available commands
- Progress Indication: Show position in the configuration process
- Direct Editing: Option to edit configuration files directly
Implementation Approach
The wizard uses a structured approach to manage screens and user interaction:
type Screen struct {
    Title         string
    Subtitle      string
    Body          string
    Instructions  string
    Replacements  []Replacement
    Questions     []Questioner
    Style         Style
    Current       int
    Wizard        *Wizard
    NavigationBar *NavigationBar
}

type Wizard struct {
    Config    *config.Config
    Screens   []Screen
    Current   int
    History   []int
    // Additional fields for wizard state
}
This design allows for a flexible, extensible configuration process that can adapt to different user needs and configuration scenarios.
Testing Strategy
Khedra employs a comprehensive testing strategy to ensure reliability and correctness.
Testing Levels
- Unit Tests: Verify individual functions and components
- Integration Tests: Test interaction between components
- Service Tests: Validate complete service behavior
- End-to-End Tests: Test full application workflows
- Performance Tests: Benchmark critical operations
Test Implementation
- Mock Objects: Simulate external dependencies
- Test Fixtures: Standard data sets for reproducible tests
- Property-Based Testing: Generate test cases to find edge cases
- Parallel Testing: Run tests concurrently for faster feedback
- Coverage Analysis: Track code coverage to identify untested areas
These technical design choices provide Khedra with a solid foundation for reliable, maintainable, and efficient operation across a variety of deployment scenarios and use cases.
Supported Chains
This section details the blockchain networks supported by Khedra, the technical requirements for each, and the implementation approaches for multi-chain support.
Chain Support Architecture
Khedra implements a flexible architecture for supporting multiple EVM-compatible blockchains simultaneously.
Chain Abstraction Layer
At the core of Khedra's multi-chain support is a chain abstraction layer that:
- Normalizes differences between chain implementations
- Provides a uniform interface for blockchain interactions
- Manages chain-specific configurations and behaviors
- Isolates chain-specific code from the core application logic
// Simplified Chain interface
type Chain interface {
    // Return the chain name
    Name() string

    // Return the chain ID
    ChainID() uint64

    // Get RPC client for this chain
    Client() rpc.Client

    // Get path to chain-specific data directory
    DataDir() string

    // Check if this chain requires special handling for a feature
    SupportsFeature(feature string) bool

    // Get chain-specific configuration
    Config() ChainConfig
}
Core Chain Requirements
For a blockchain to be fully supported by Khedra, it must meet these technical requirements:
RPC Support
The chain must provide an Ethereum-compatible JSON-RPC API with these essential methods:
-
Basic Methods:
eth_blockNumber: Get the latest block numbereth_getBlockByNumber: Retrieve block dataeth_getTransactionReceipt: Get transaction receipts with logseth_chainId: Return the chain identifier
-
Trace Support:
- Either
debug_traceTransactionortrace_transaction: Retrieve execution traces - Alternatively:
trace_blockordebug_traceBlockByNumber: Get all traces in a block
- Either
Data Structures
The chain must use compatible data structures:
- Addresses: 20-byte Ethereum-compatible addresses
- Transactions: Compatible transaction format with standard fields
- Logs: EVM-compatible event logs
- Traces: Call traces in a format compatible with Khedra's processors
Consensus and Finality
The chain should have:
- Deterministic Finality: Clear rules for when blocks are considered final
- Manageable Reorgs: Limited blockchain reorganizations
- Block Time Consistency: Relatively consistent block production times
Ethereum Mainnet
Ethereum mainnet is the primary supported chain and is required even when indexing other chains.
Special Considerations
- Block Range: Support for full historical range from genesis
- Archive Node: Full archive node required for historical traces
- Trace Support: Must support either Geth or Parity trace methods
- Size Considerations: Largest data volume among supported chains
Implementation Details
// Ethereum mainnet-specific configuration
type EthereumMainnetChain struct {
    BaseChain
    traceMethod string  // "geth" or "parity" style traces
}

func (c *EthereumMainnetChain) ProcessTraces(traces []interface{}) []Appearance {
    // Mainnet-specific trace processing logic
    // ...
}
EVM-Compatible Chains
Khedra supports a variety of EVM-compatible chains with minimal configuration.
Officially Supported Chains
These chains are officially supported with tested implementations:
-
Ethereum Testnets:
- Sepolia
- Goerli (legacy support)
-
Layer 2 Networks:
- Optimism
- Arbitrum
- Polygon
-
EVM Sidechains:
- Gnosis Chain (formerly xDai)
- Avalanche C-Chain
- Binance Smart Chain
Chain Configuration
Each chain is configured with these parameters:
chains:
  mainnet:  # Chain identifier
    rpcs:   # List of RPC endpoints
      - "https://ethereum-rpc.example.com"
    enabled: true  # Whether the chain is active
    trace_support: "geth"  # Trace API style
    # Chain-specific overrides
    scraper:
      batch_size: 500
Chain-Specific Adaptations
Some chains require special handling:
- Optimism/Arbitrum: Modified trace processing for rollup architecture
- Polygon: Adjusted finality assumptions for PoS consensus
- BSC/Avalanche: Faster block times requiring different batch sizing
Chain Detection and Validation
Khedra implements robust chain detection and validation:
Auto-Detection
When connecting to an RPC endpoint:
- Query
eth_chainIdto determine the actual chain - Verify against the configured chain identifier
- Detect trace method support through API probing
- Identify chain-specific capabilities
Connection Management
For each configured chain:
- Connection Pool: Maintain multiple connections for parallel operations
- Failover Support: Try alternative endpoints when primary fails
- Health Monitoring: Track endpoint reliability and performance
- Rate Limiting: Respect provider-specific rate limits
Data Isolation
Khedra maintains strict data isolation between chains:
- Chain-Specific Directories: Separate storage locations for each chain
- Independent Indices: Each chain has its own Unchained Index
- Configuration Isolation: Chain-specific settings don't affect other chains
- Parallel Processing: Chains can be processed concurrently
Adding New Chain Support
For adding support for a new EVM-compatible chain:
- Configuration: Add the chain definition to
config.yaml - Custom Handling: Implement any chain-specific processors if needed
- Testing: Verify compatibility with the new chain
- Documentation: Update supported chains documentation
Example: Adding a New Chain
// Register a new chain type
func RegisterNewChain() {
    registry.RegisterChain("new-chain", func(config ChainConfig) (Chain, error) {
        return &NewChain{
            BaseChain: NewBaseChain(config),
            // Chain-specific initialization
        }, nil
    })
}

// Implement chain-specific behavior
type NewChain struct {
    BaseChain
    // Chain-specific fields
}

func (c *NewChain) SupportsFeature(feature string) bool {
    // Chain-specific feature support
    switch feature {
    case "trace":
        return true
    case "state_diff":
        return false
    default:
        return c.BaseChain.SupportsFeature(feature)
    }
}
Khedra's flexible chain support architecture allows it to adapt to the evolving ecosystem of EVM-compatible blockchains while maintaining consistent indexing and monitoring capabilities across all supported networks.
Command-Line Interface
Khedra provides a deliberately small command-line interface (CLI) focused on what actually exists today: initialization, daemon startup, configuration viewing/editing, and pausing / unpausing certain services.
CLI Architecture
The CLI is built using the urfave/cli library. There are no hidden subcommands beyond those listed below, and no status / metrics / restart commands at present.
Design Principles
- Simplicity: Minimal command set focused on essential operations
- Clarity: Each command has a clear, single purpose
- REST API Integration: Service control via HTTP API for automation
- Self-Documenting: Built-in help for all commands
Command Overview
Khedra implements these core commands (current implementation):
Essential Commands
khedra init
Initialize Khedra configuration interactively.
khedra init
Launches an interactive wizard that configures:
- General settings (data directories, logging)
- Chain configurations (RPC endpoints, indexing preferences)
- Service settings (which services to enable)
- Service ports (API, control, IPFS services)
khedra daemon
Start Khedra daemon with all configured services.
khedra daemon
Starts enabled services in a simple order: Control first, then the remaining enabled services in whatever order the configuration map iteration yields (not guaranteed / currently unordered). Services:
- Scraper (pausable)
- Monitor (pausable, disabled by default; functionality limited)
- API (if enabled)
- IPFS (if enabled)
- Control (always started)
The daemon runs until interrupted (Ctrl+C) or receives a termination signal.
khedra config
Manage Khedra configuration.
# Display current configuration
khedra config show

# Edit configuration in default editor
khedra config edit
Configuration management:
show: Display current configuration in readable formatedit: Open configuration file in system editor (respects$EDITORenvironment variable)
khedra pause <service>
Pause running services.
# Pause specific services
khedra pause scraper
khedra pause monitor

# Pause all pausable services
khedra pause all
Supported Services:
scraper: Blockchain indexing servicemonitor: Address monitoring serviceall: All pausable services
Non-Pausable Services: control, api, ipfs.
khedra unpause <service>
Resume paused services.
# Resume specific services
khedra unpause scraper
khedra unpause monitor

# Resume all paused services
khedra unpause all
Same service support as pause command. A service must be paused to unpause it. Only scraper and monitor are recognized plus the alias all.
Control Service API
Pause/unpause operations are available via a minimal HTTP interface on the Control Service (first available of ports 8338, 8337, 8336, 8335). Mutating operations use HTTP GET.
Status Queries
# Check all service status
curl "http://localhost:8338/isPaused"

# Check specific service
curl "http://localhost:8338/isPaused?name=scraper"
curl "http://localhost:8338/isPaused?name=monitor"
Pause Operations (implemented as HTTP GET)
# Pause specific service
curl "http://localhost:8338/pause?name=scraper"
curl "http://localhost:8338/pause?name=monitor"

# Pause all pausable services
curl "http://localhost:8338/pause?name=all"
curl "http://localhost:8338/pause"    # alternative
Unpause Operations (implemented as HTTP GET)
# Unpause specific service
curl "http://localhost:8338/unpause?name=scraper"
curl "http://localhost:8338/unpause?name=monitor"

# Unpause all services
curl "http://localhost:8338/unpause?name=all"
curl "http://localhost:8338/unpause"   # alternative
API Responses
Status queries return simple JSON arrays like:
[
  {"name": "scraper", "status": "running"},
  {"name": "monitor", "status": "paused"},
  {"name": "control", "status": "not pausable"},
  {"name": "ipfs", "status": "not pausable"}
]
Control operations return result arrays. Example:
[
  {"name": "scraper", "status": "paused"}
]
Error Handling
Invalid service names return an error JSON body with 400.
{"error": "service 'invalid' not found or is not pausable"}
Usage Examples
Complete Startup Workflow
# 1. Initialize configuration (first time only)
khedra init

# 2. Start daemon
khedra daemon
Service Management During Operation
# Check what's running
curl "http://localhost:8338/isPaused"

# Pause indexing temporarily
khedra pause scraper

# Resume when ready
khedra unpause scraper

# Pause everything for maintenance
khedra pause all

# Resume normal operations
khedra unpause all
Configuration Management
# View current settings
khedra config show

# Modify configuration
khedra config edit

# Restart daemon to apply changes
# (stop with Ctrl+C, then restart)
khedra daemon
Environment Variables (current)
TB_KHEDRA_WAIT_FOR_NODE(optional): process name to block on before startingTB_KHEDRA_WAIT_SECONDS(default 30 if waiting): post-detect delayTB_KHEDRA_LOGGING_LEVEL: one ofdebug|info|warn|errorEDITOR: used bykhedra config edit
Error Handling
Common Issues
Service not found: Ensure service name is correct (scraper, monitor, or all)
Control service unavailable: Verify daemon is running and control service is enabled
Permission denied: Ensure proper file permissions for configuration and data directories
Port conflicts: Control service scans 8338 → 8335 and uses the first open port
Debugging
Enable debug logging:
TB_KHEDRA_LOGGING_LEVEL=debug khedra daemon
Check service status:
curl "http://localhost:8338/isPaused"
View configuration:
khedra config show
Performance and Scalability
This chapter documents the tunable parameters that exist in the current codebase.
1. Tunable Parameters
The runtime tuning levers exposed in config.yaml:
services.scraper.sleep(seconds between batch cycles)services.scraper.batchSize(approximate blocks per batch)services.monitor.sleep(monitor disabled by default)services.monitor.batchSizeenabledflags per service
API & IPFS have port values; scraper/monitor do not expose listeners here.
2. Practical Tuning Guidance
Start with defaults (sleep ≈ 10–12s, batchSize 500). Adjust slowly:
- High idle CPU & stable RAM → increase batchSize moderately (e.g. 750 → 1000)
- RPC errors / rate limits → decrease batchSize or increase sleep
- Memory pressure → decrease batchSize first; then increase sleep if needed
- Slow catch-up → cautiously increase batchSize (ensure RPC can handle)
Heuristic Table
| Situation | Action |
|---|---|
| Idle resources | Increase batchSize |
| RPC timeouts / 429s | Decrease batchSize or add sleep |
| Rising memory usage | Decrease batchSize |
| Far behind chain tip | Increase batchSize if safe |
3. Measuring
Use OS tools:
- CPU / Mem:
top,ps - Disk growth:
du -sh ~/.khedra - RPC latency: ad hoc
curlagainsteth_blockNumber
Use external observation tools; there is no embedded metrics endpoint.
4. Scaling Modes
Single-process only. You may run separate processes per chain (with isolated config directories) if desired. Keep combined RPC load in mind.
5. Monitor Service
Monitor is disabled by default and supports pause/unpause.
6. Summary
Tuning today = batchSize + sleep + enable/disable services. Measure effects externally. Accuracy now takes precedence over aspirational detail.
Concise by design.
Integration Points
Integration with External APIs
Khedra exposes data through a REST API, making it compatible with external applications. Example use cases:
- Fetching transaction details for a given address.
- Retrieving block information for analysis.
Interfacing with IPFS
If the IPFS service is enabled in config.yaml it will be started with the daemon. There is no --ipfs on CLI flag; previous documentation using that syntax was incorrect.
Customizing for Specific Use Cases
Users can tailor the configuration by:
- Editing
config.yaml(wizard orkhedra config edit) to set chains, RPC endpoints, and service enablement. - Using shell scripts to automate pause/unpause via the control endpoints.
Testing and Validation
Unit Testing
Unit tests cover:
- Blockchain indexing logic.
- Configuration parsing and validation.
- REST API endpoint functionality.
Run tests with:
go test ./...
Integration Testing
Integration tests ensure all components work together as expected. Tests include:
- RPC connectivity validation.
- Multi-chain indexing workflows.
Testing Guidelines for Developers
- Use mock RPC endpoints for testing without consuming live resources.
- Validate
.envconfiguration in test environments before deployment. - Automate tests with CI/CD pipelines to ensure reliability.
Wizard Screen Documentation
Introduction
Khedra's configuration wizard provides a streamlined, interactive way to set up your installation. Rather than manually editing the config.yaml file, the wizard walks you through each configuration section with clear explanations and validation.
User Interface Features
The wizard provides several helpful features:
- Keyboard Navigation: Use arrow keys and shortcuts to navigate
- Contextual Help: Press 'h' on any screen for detailed documentation
- Editor Integration: Press 'e' to directly edit configuration files
- Validation: Input is checked for correctness before proceeding
- Visual Cues: Consistent layout with clear indicators for navigation options
Using the Wizard
Start the Wizard with:
khedra init
Implementation Details
The configuration wizard described in this document is implemented through a package of Go files in the pkg/wizard directory:
Core Wizard Framework
-
Main Wizard Structure:
pkg/wizard/wizard.go- Defines theWizardstruct and methods for managing the wizard state, navigation between screens, and execution flow -
Screen Component:
pkg/wizard/screen.go- Implements theScreenstruct representing individual wizard pages with questions and display logic -
Question Framework:
pkg/wizard/question.go- Provides theQuestionstruct and interface for gathering and validating user input -
User Interface:
pkg/wizard/display.go- Handles rendering screens and questionspkg/wizard/style.go- Controls visual styling of the wizard interfacepkg/boxes/boxes.go- Implements the ASCII box drawing for wizard screens
-
Navigation:
pkg/wizard/navigation.go- Implements the navigation bar and controlspkg/wizard/shortcuts.go- Handles keyboard shortcuts
Wizard Screen Implementations
The specific wizard screens visible in the user interface are implemented in these files:
- Welcome Screen:
app/action_init_welcome.go - General Settings:
app/action_init_general.go - Services Config:
app/action_init_services.go - Chain Config:
app/action_init_chains.go - Summary Screen:
app/action_init_summary.go
Integration with Configuration System
The wizard integrates with the configuration system through:
- Configuration Loading: In the
ReloaderFnfunction passed to the wizard - Configuration Validation: Through the validation functions for each input field
- Configuration Saving: In the final step of the wizard workflow
The wizard framework uses a screen-based approach with forward/backward navigation, real-time validation, and contextual help, exactly as described in this document.
Welcome Screen
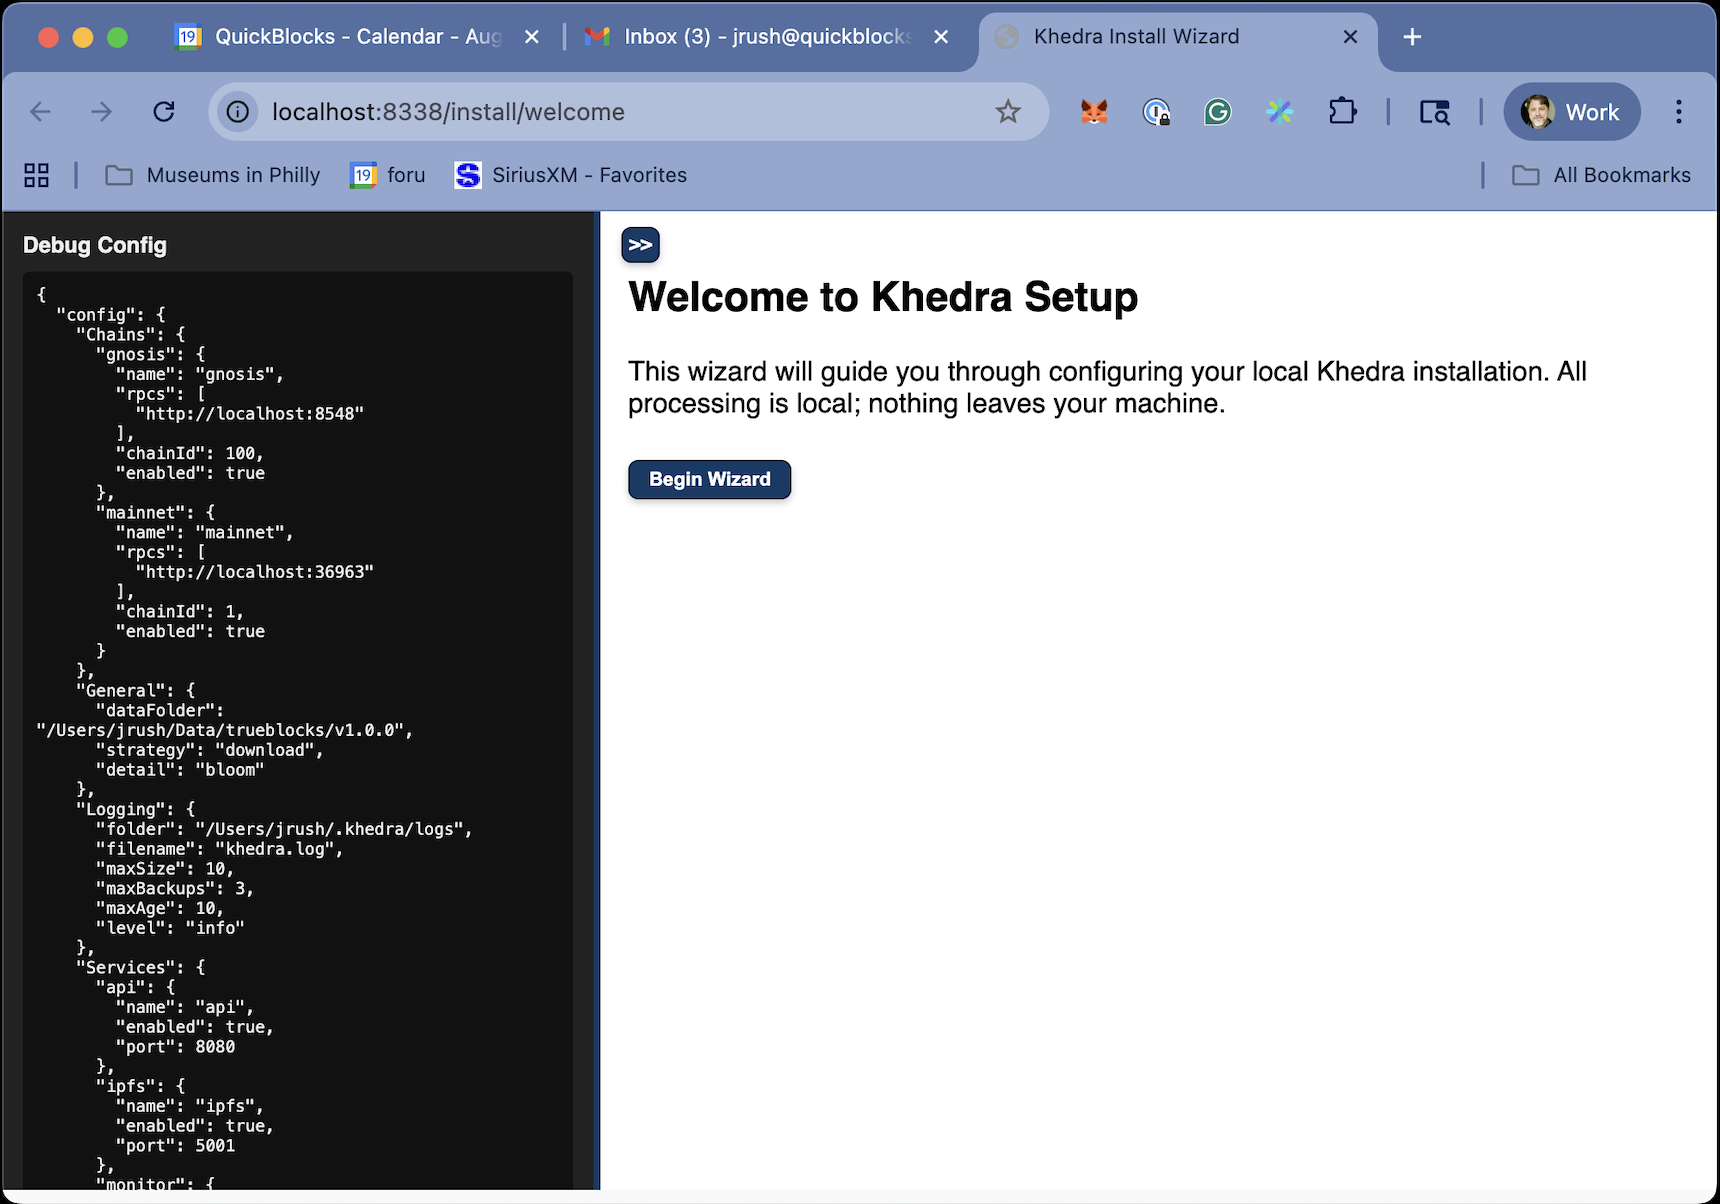
Purpose
- Introduces the wizard to the user
- Orients the user to the configuration process
- Provides clear navigation instructions
The welcome screen serves as the entry point to the configuration process, designed to be approachable while providing clear direction on how to proceed. The sidebar to the left show the current contents of the configuration file. You may show it or hide with the expander.
Paths Screen
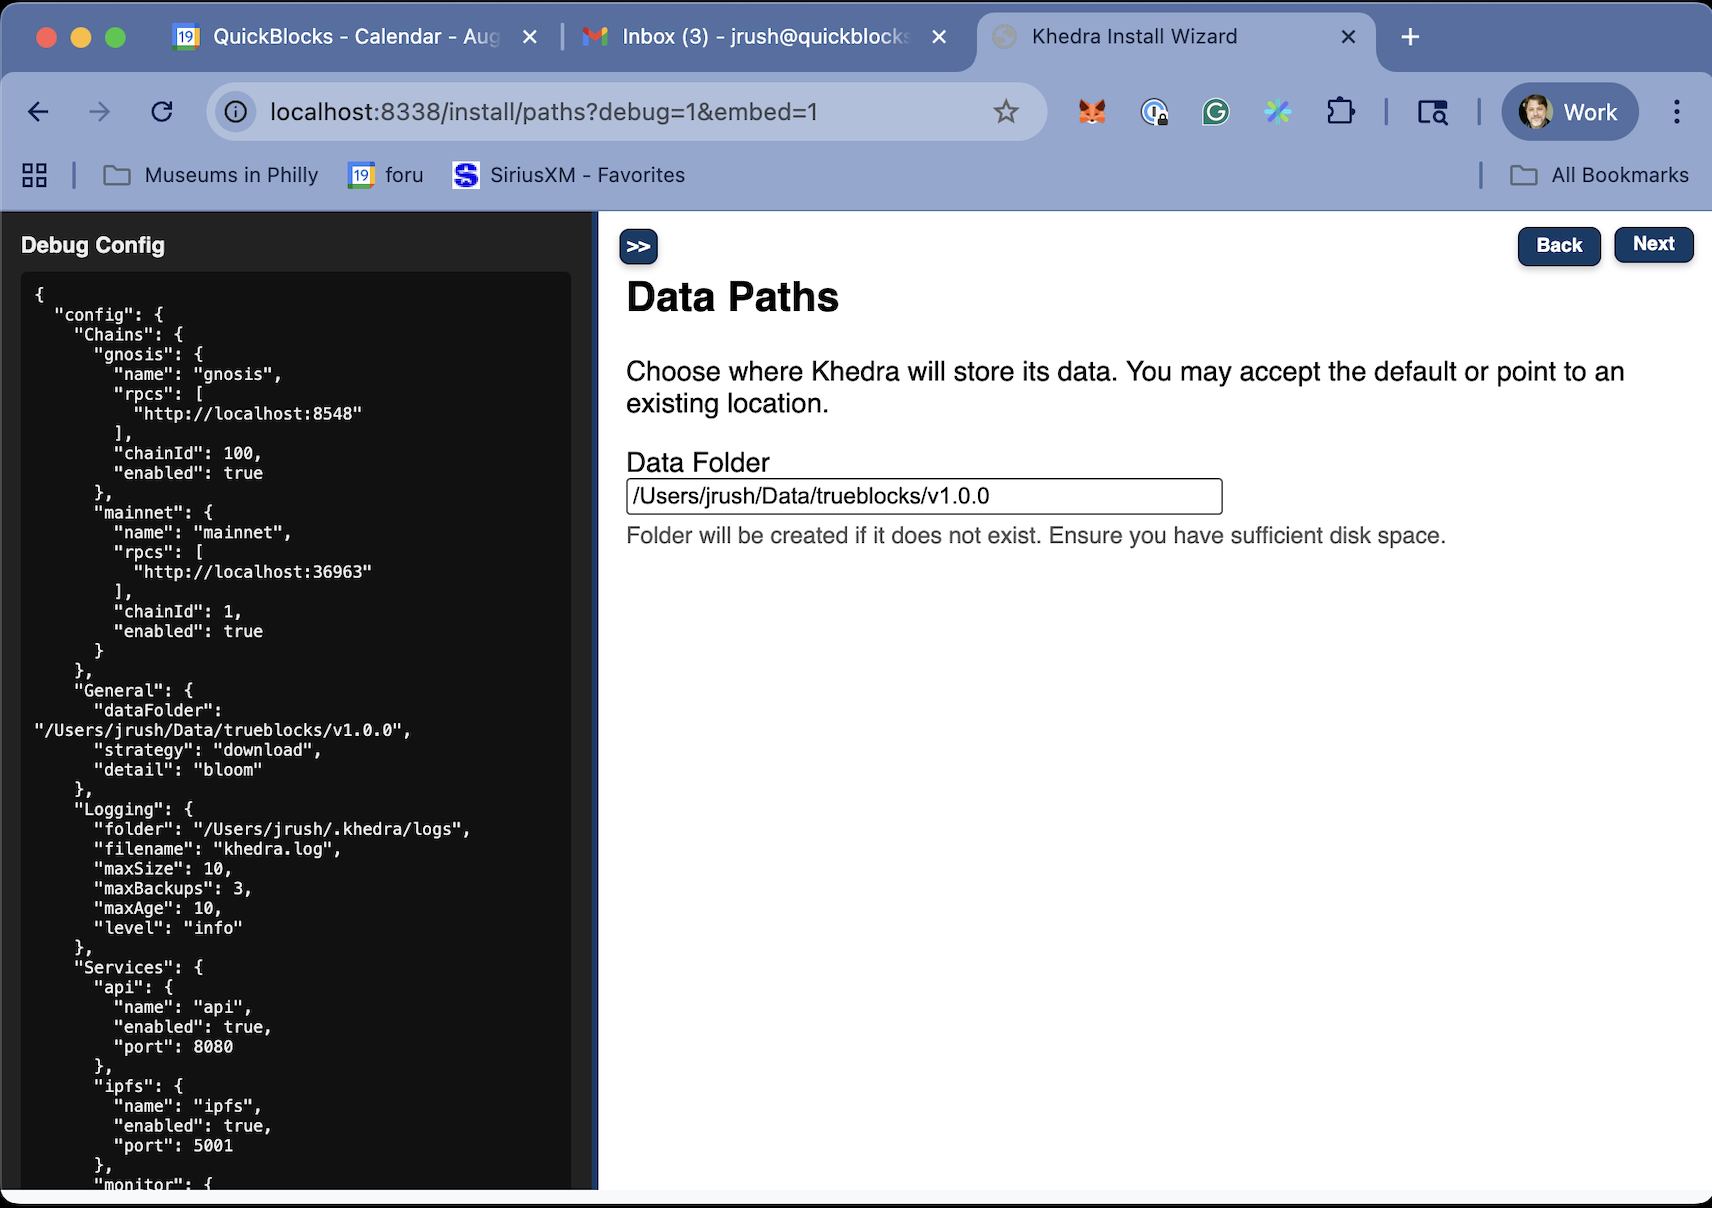
Purpose
- Allows users to configure high-level application settings
- Sets up crucial file paths for data storage
Key Features
- Define the main data folder location with path expansion support
- We suggest you use an external SSD drive of at least 2TB. Faster is better.
- Options for path expansion (supporting $HOME and ~/ notation)
- Input validation for directory existence and write permissions
Configuration Options
This screen presents these key configuration options:
- Data Folder: Where Khedra stores all index and cache data
- Default:
~/.khedra/data - Must be a writable location with sufficient disk space
- Default:
Chains Screen
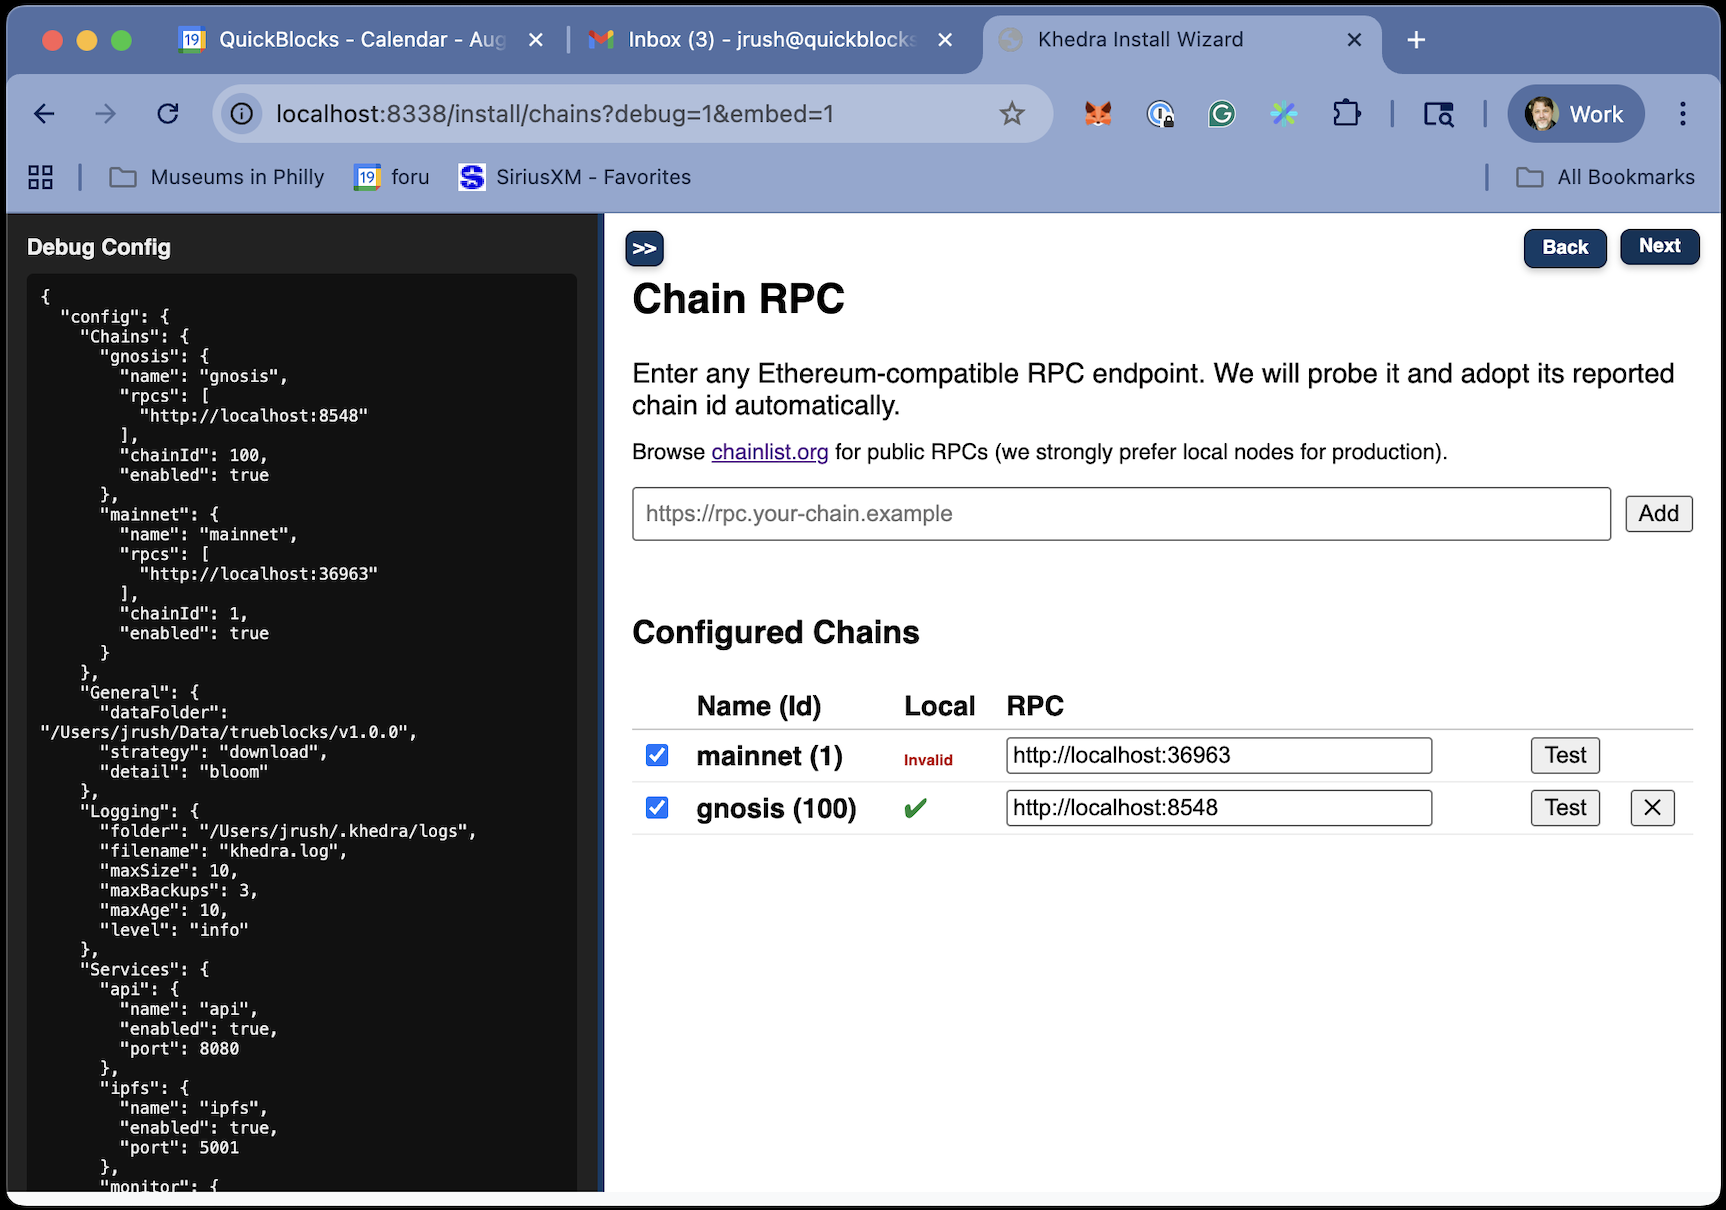
Purpose
- Configures blockchain connections for indexing and monitoring
- Ensures proper RPC endpoint setup for each chain
- Explains the requirement for Ethereum mainnet
Key Features
- Multiple chain support with standardized naming
- RPC endpoint configuration and validation
- Clear explanation of requirements and format
Chain Configuration
The chains configuration screen guides you through setting up:
-
Ethereum Mainnet (Required)
- At least one valid RPC endpoint
- Used for core functionality and the Unchained Index
-
Additional EVM Chains (Optional)
- Sepolia, Gnosis, Optimism, and other EVM-compatible chains
- Each requires at least one RPC endpoint
- Enable/disable option for each chain
RPC Endpoint Requirements
For each chain, you must provide:
- A valid RPC URL in the format
protocol://host:port - Proper authentication details if required (e.g., Infura project ID)
- Endpoints with sufficient capabilities for indexing (archive nodes recommended)
Validation Checks
The wizard performs these validations on each RPC endpoint:
- URL format validation
- Connection test to verify the endpoint is reachable
- Chain ID verification to ensure the endpoint matches the selected chain
- API method support check for required JSON-RPC methods
Index Screen
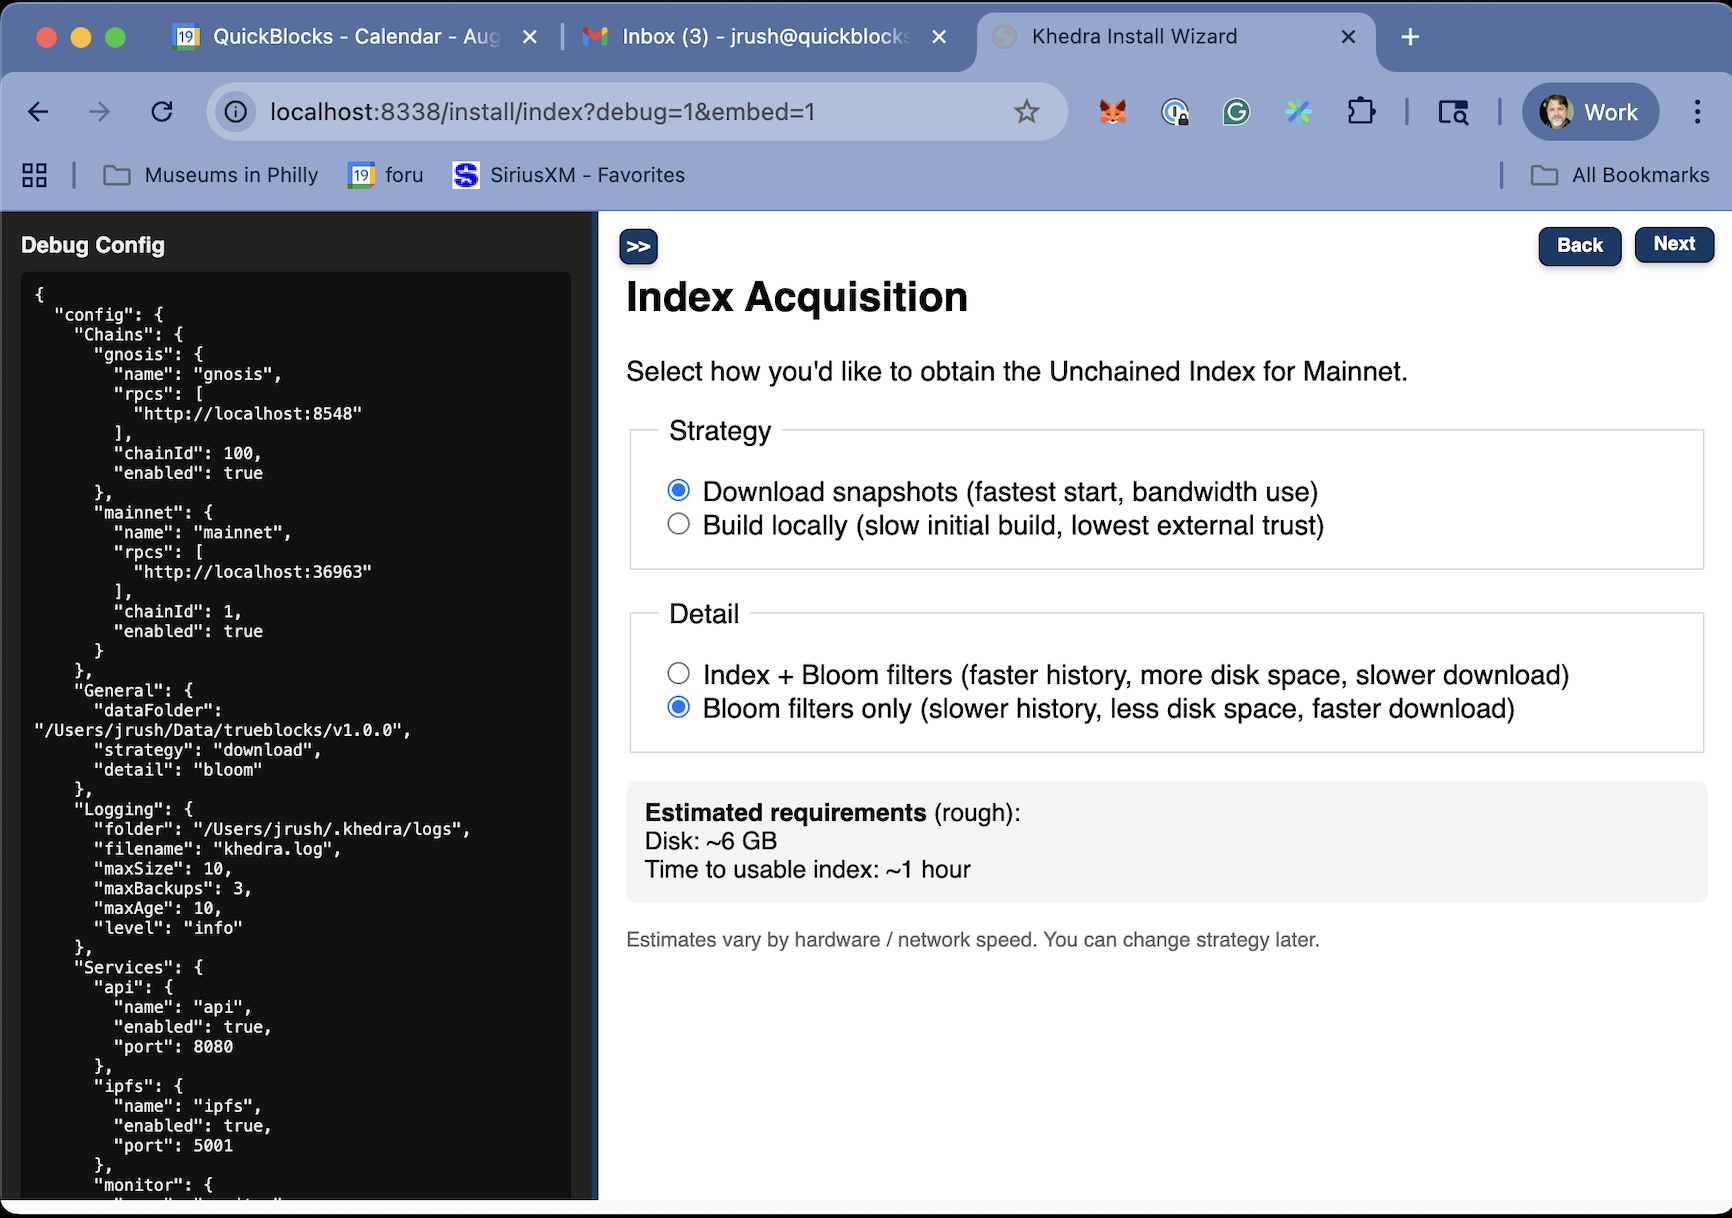
Purpose
- Allows users to configure the method by which the Unchained Index is created or downloaded
- The Unchained Index is required for the applications to properly function
- Estimates of disc space usage are exactly that -- estimates.
Key Features
- The Unchained Index will be stored in the [Data Folder]/unchained.
- Blooms are much smaller than the index, but take longer to find histories
- Indexes are larger, but do not need to be downloaded later
Configuration Options
The General Settings screen presents these key configuration options:
- Index Download Strategy:
- Download: Prioritize downloading from the distributed network
- Scratch: Prioritize building the index locally
- Index + Blooms: Download or build both the indexes and the blooms
- Blooms: Download only bloom filters.
Services Screen
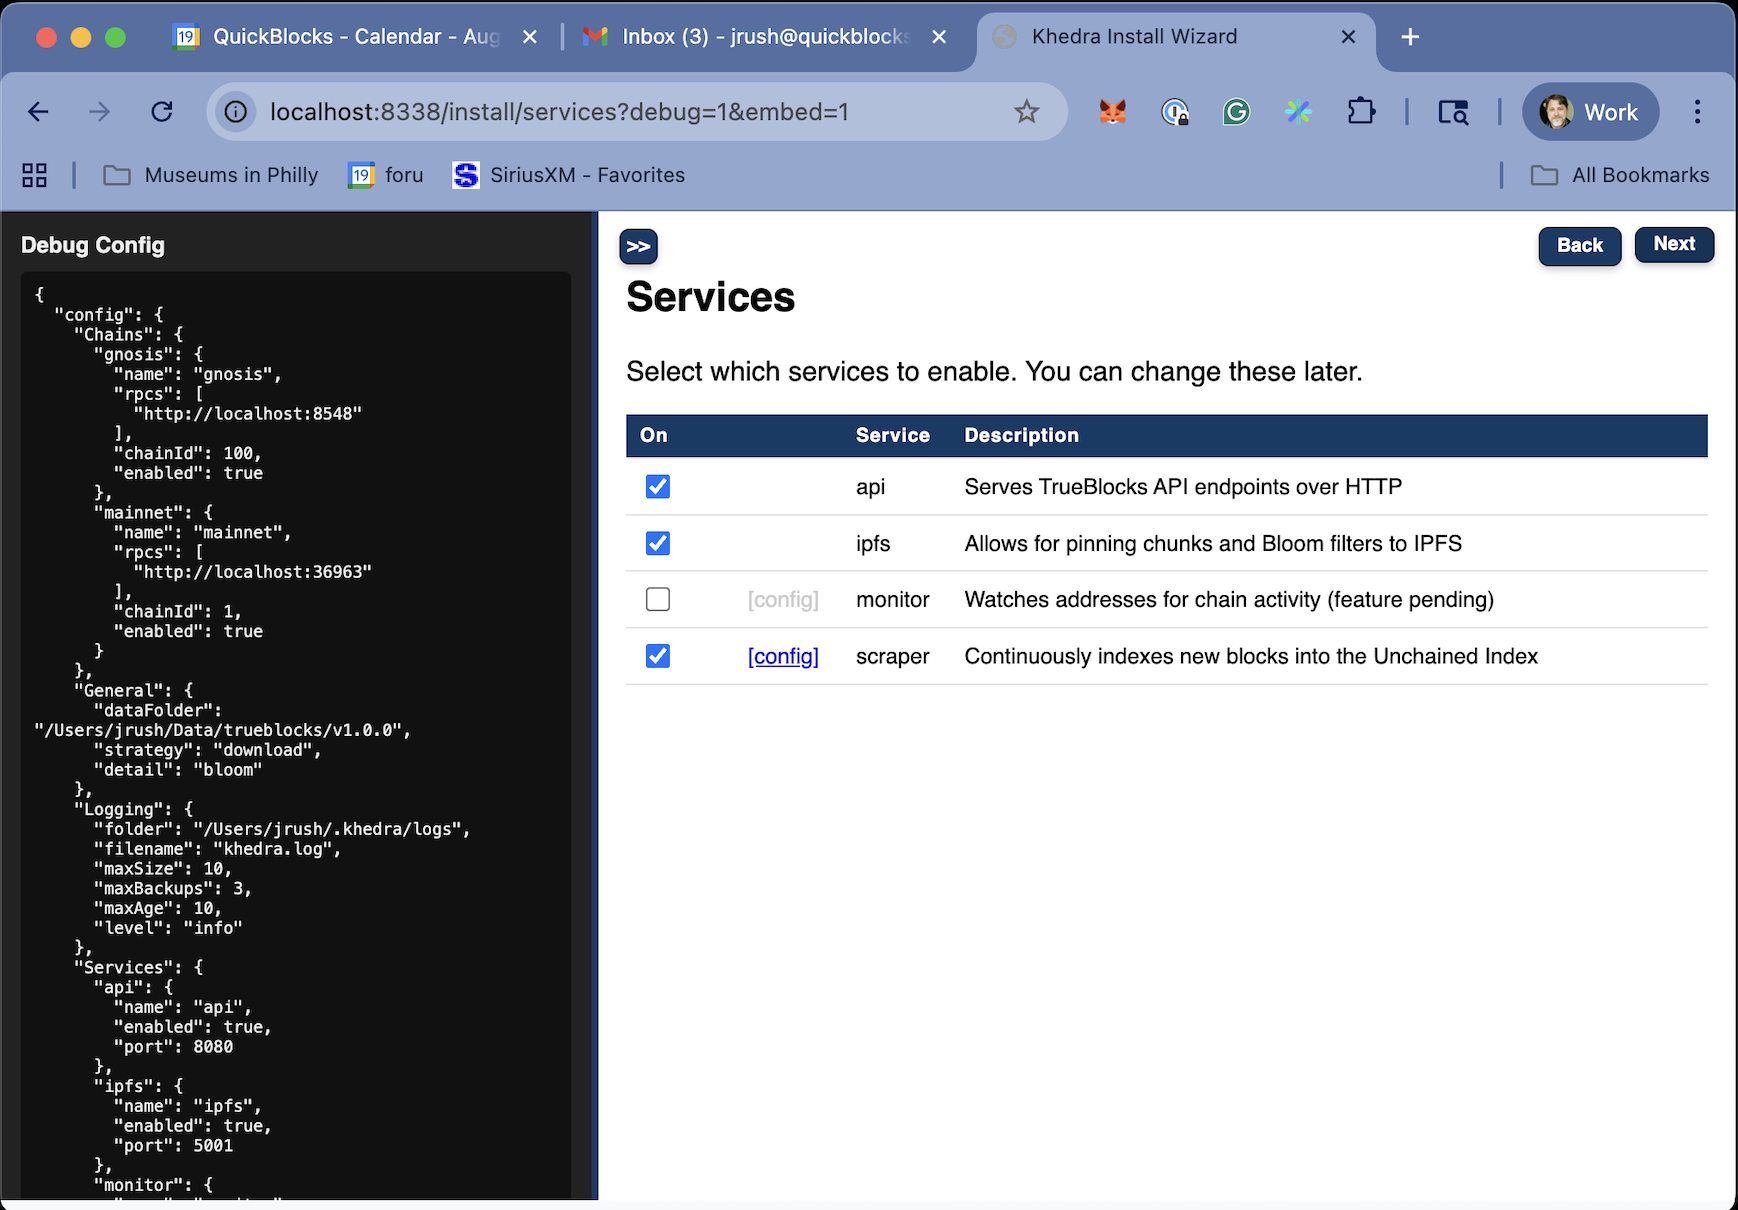
Purpose
- Enables users to select and configure Khedra's core services
- Explains the relationship between the services
- Ensures at least one service is enabled for proper functionality
Available Services
Khedra offers five core services that work together:
-
Control Service: Management endpoints for the other services
- Always enabled - no control
- Provides a central API for managing other services
-
Scraper Service: Builds and maintains the Unchained Index
- Processes blocks to extract address appearances
- Configurable batch size and sleep interval
-
Monitor Service: Tracks specific addresses of interest
- Provides notifications for address activities
- Configurable batch size and sleep interval
-
API Service: REST API for data access
- Configurable port number
- Provides endpoints for querying the index and monitors
-
IPFS Service: Distributed data sharing
- Enables sharing and downloading index data
- Configurable port number
Configuration Parameters
For each service, you can configure:
- Enabled/Disabled: Toggle the service on or off
In the config file:
- Port numbers: For services that expose network endpoints
- Batch size: Number of blocks processed in one batch (for scraper/monitor)
- Sleep interval: Time to wait between batches (for scraper/monitor)
- Resource limits: Memory and CPU constraints
Logging Screen
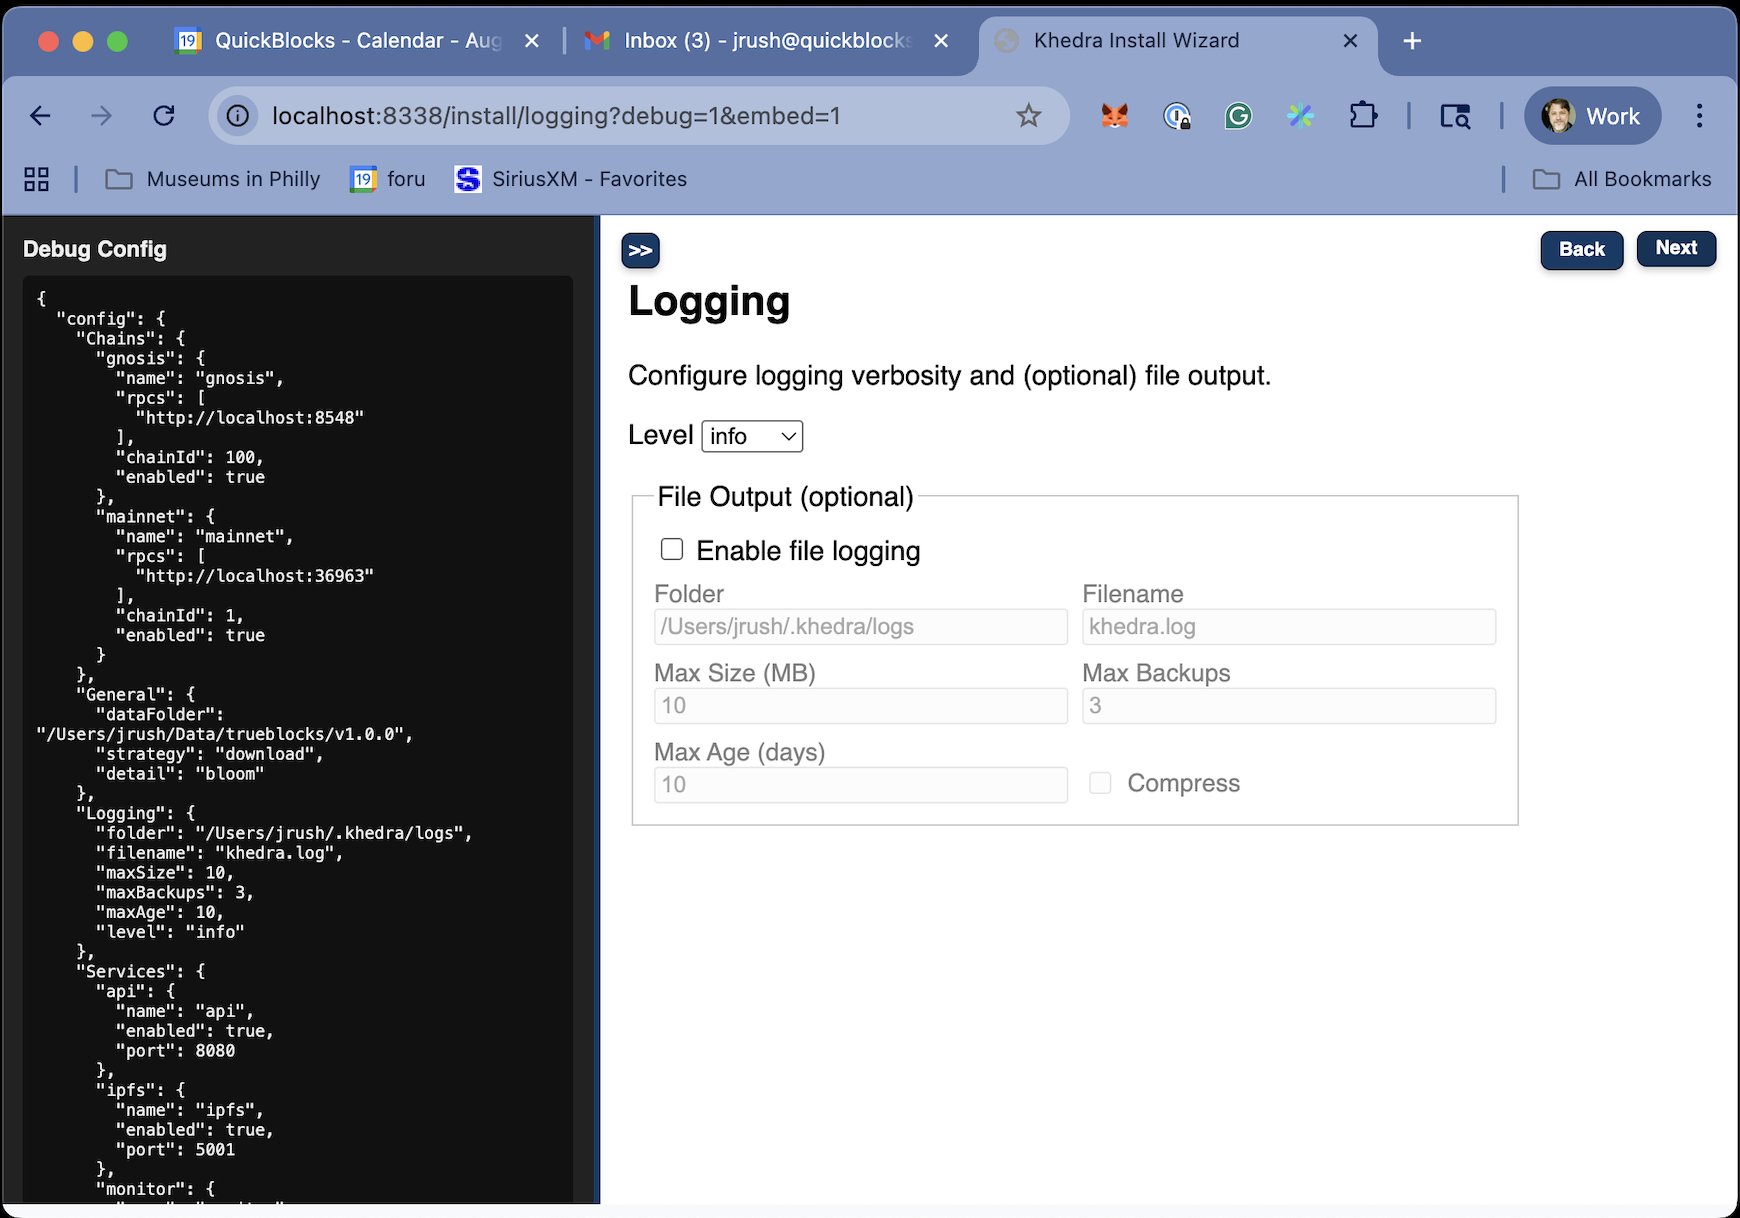
Purpose
- Allows users to configure logging options
- Allows for toFile or onlyConsole
- Configures logging behavior
Key Features
- Set up logging preferences for troubleshooting
- Options for path expansion (supporting $HOME and ~/ notation)
- Input validation for directory existence and write permissions
Configuration Options
The Logging Settings screen presents these key configuration options:
- Logging Folder: Where Khedra stores all index and cache data
- Default:
~/.khedra/logs - Must be a writable location with sufficient disk space
- Default:
Summary Screen
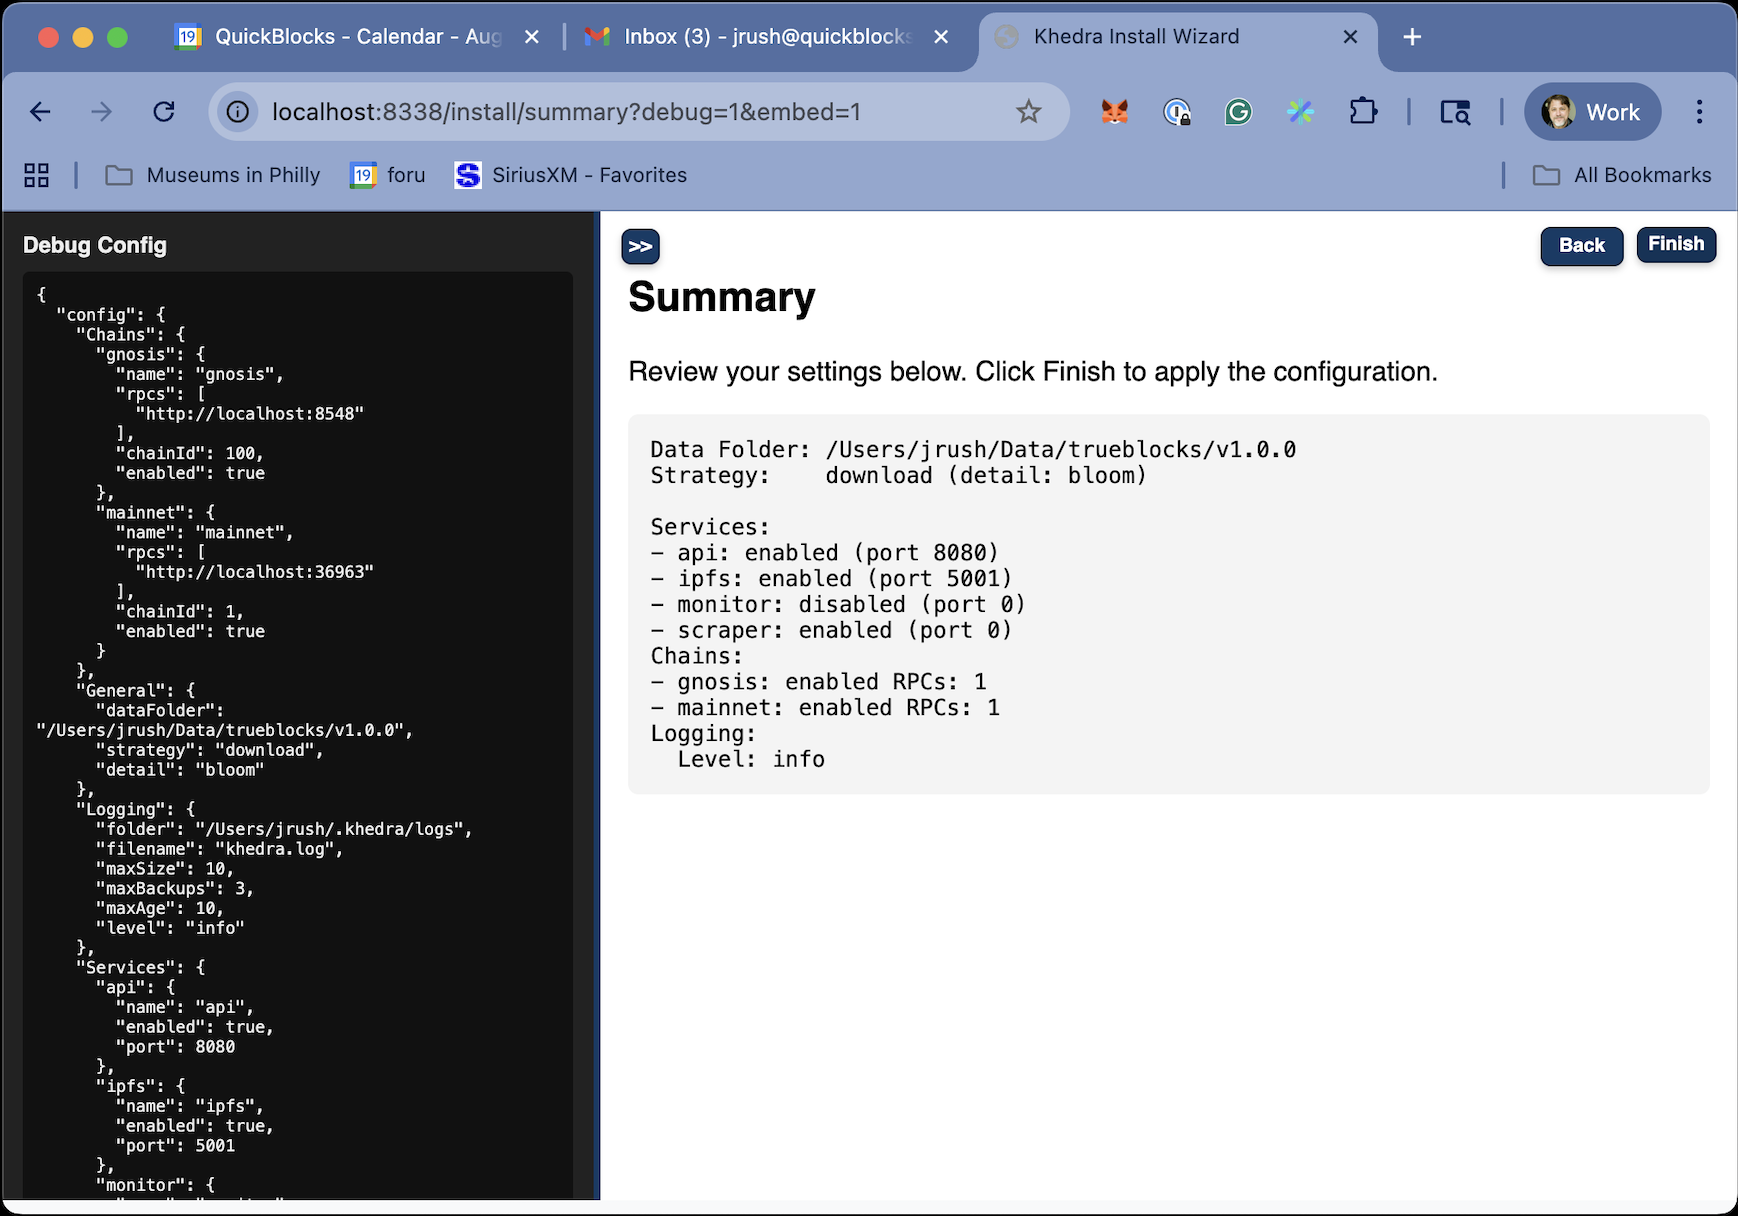
Purpose
- Provides a review of all configured settings
- Offers a final chance to make adjustments before saving
- Summarizes the configuration in a clear, readable format
Configuration Summary Display
The summary screen presents the configuration organized by section:
-
General Settings
- Data folder location
- Download strategy
- Logging configuration
-
Services Configuration
- Enabled/disabled status for each service
- Port numbers and key parameters
- Resource allocations
-
Chain Settings
- Configured blockchains
- RPC endpoints
- Chain-specific settings
When the user chooses to finish, the wizard writes the configuration to ~/.khedra/config.yaml by default, or to an alternative location if specified during the process.
If the user chooses to edit the file directly (khedra config edit), the wizard will invoke the system's default editor (or the editor specified in the EDITOR environment variable) and then reload the configuration after editing.
Dashboard Screen
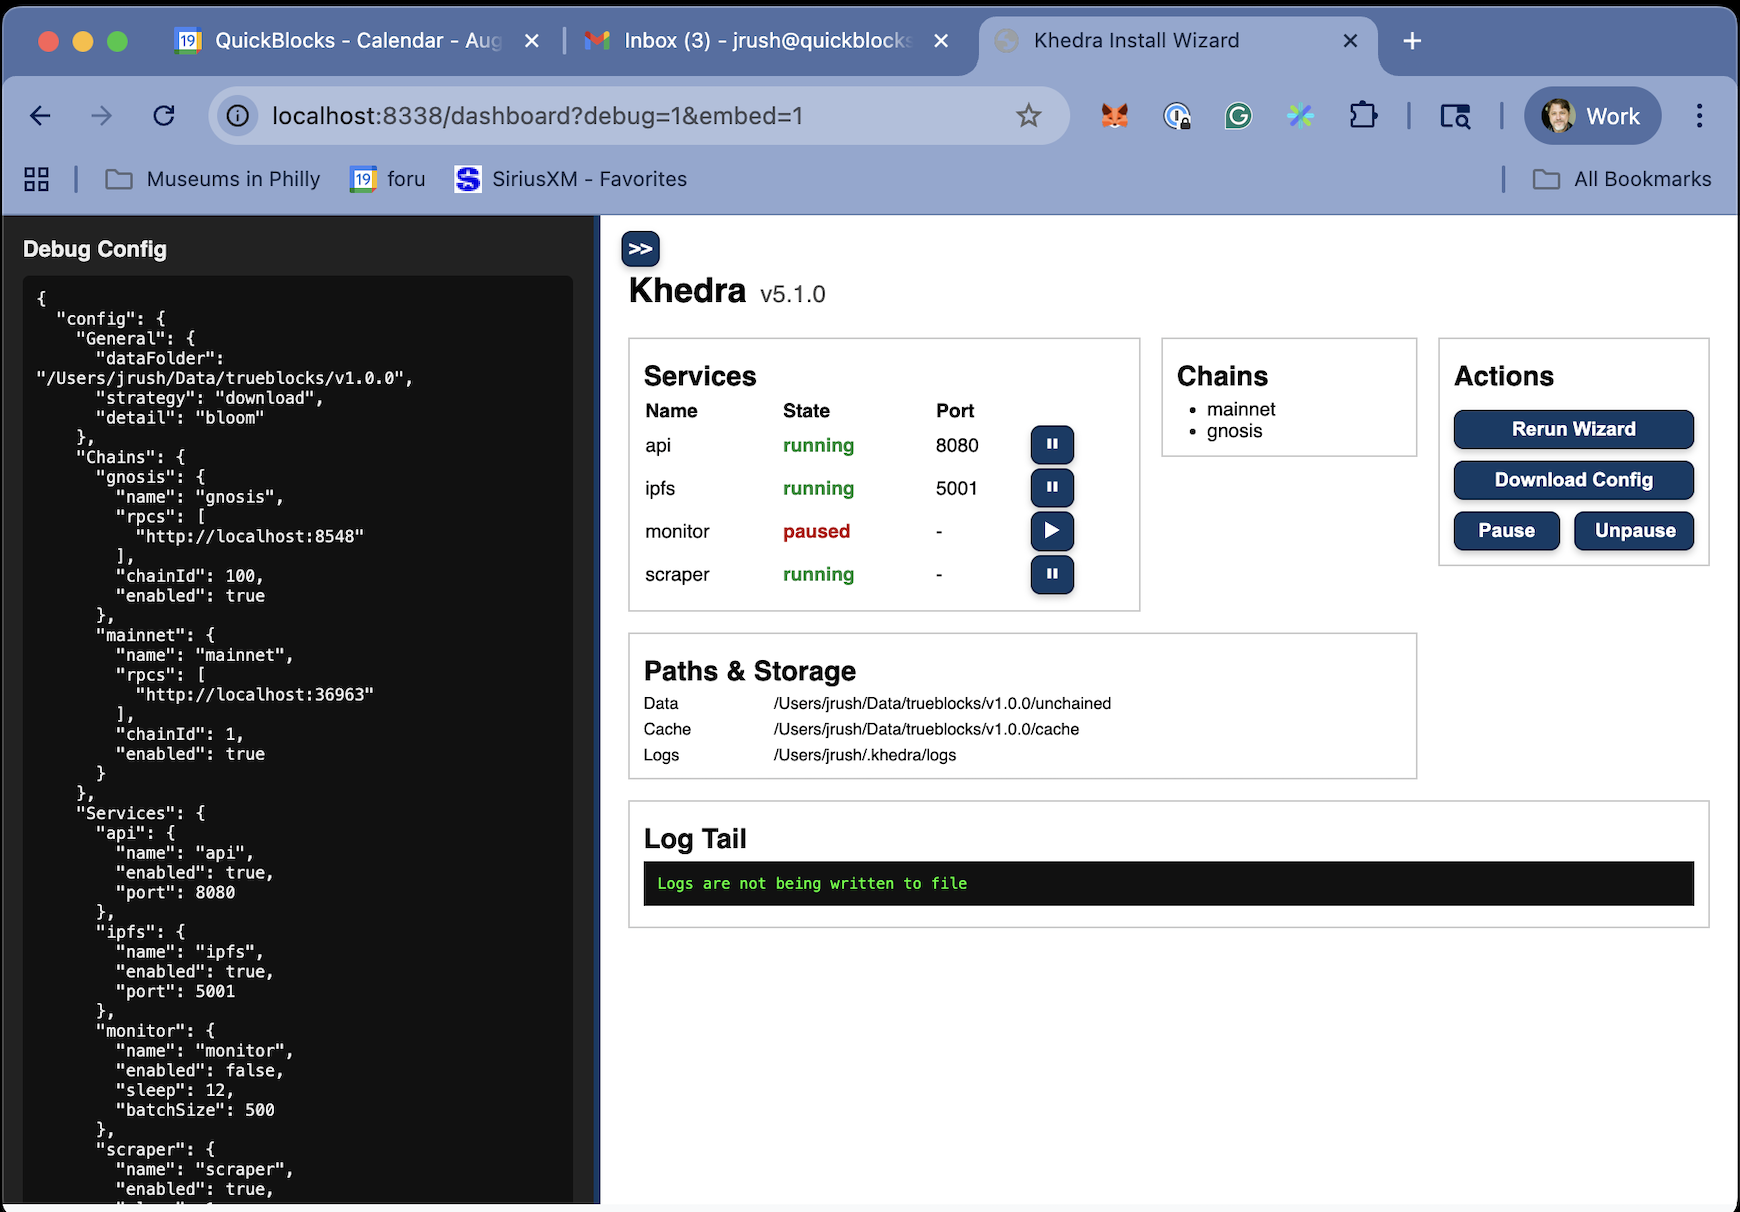
Purpose
- Provides an overview of the Khedra installation status
- Displays service states and available chains
- Shows key file paths and log status
- Offers quick actions for configuration and control
Main Features
- Services Table: Shows the state (running/paused) and port of each service (api, ipfs, monitor, scraper)
- Chains List: Displays enabled chains (mainnet, gnosis)
- Actions Panel: Buttons for rerunning the wizard, downloading config, pausing, and unpausing services
- Paths & Storage: Lists locations for data, cache, and logs
- Log Tail: Shows recent log status (e.g., "Logs are not being written to file")
Appendices
Glossary of Terms
Glossary of Technical Terms
- EVM: Ethereum Virtual Machine, the runtime environment for smart contracts in Ethereum and similar blockchains.
- RPC: Remote Procedure Call, a protocol for interacting with blockchain nodes.
- Indexing: The process of organizing blockchain data for fast and efficient retrieval.
- IPFS: InterPlanetary File System, a decentralized storage solution for sharing and retrieving data.
Frequently Asked Questions (FAQ)
1. What chains are supported by Khedra?
Khedra supports Ethereum mainnet and other EVM-compatible chains such as Sepolia and Gnosis. Additional chains can be added by configuring the TB_NODE_CHAINS environment variable.
2. Do I need an RPC endpoint for every chain?
Yes, each chain you want to index or interact with requires a valid RPC endpoint specified in the .env file.
3. Can I run Khedra without IPFS?
Yes, IPFS integration is optional and can be enabled or disabled using the --ipfs command-line option.
References and Further Reading
Additional Technical References and Resources
- TrueBlocks GitHub Repository
- TrueBlocks Official Website
- Ethereum Developer Documentation
- IPFS Documentation
Index
-
Address Monitoring:
- Implementation:
app/action_daemon.go(Monitor service initialization andMonitorsOptionsstruct)
- Implementation:
-
API Access:
- Implementation:
app/action_daemon.go(API service initialization)
- Implementation:
-
Blockchain Indexing:
- Implementation:
app/action_daemon.go(Scraper service initialization)
- Implementation:
-
Chains Configuration:
- Implementation:
app/action_init_chains.go(Chain wizard implementation)pkg/types/chain.go(Chain struct definition and validation)
- Implementation:
-
Configuration Management:
- Implementation:
app/config.go(Configuration loading and initialization)app/action_config_show.go(Show config command)app/action_config_edit.go(Edit config command)
- Implementation:
-
Glossary: Chapter 7, Section "Glossary of Terms"
-
IPFS Integration:
- Implementation:
app/action_daemon.go(IPFS service initialization)pkg/types/service.go(IPFS service definition)
- Implementation:
-
Logging and Debugging:
- Implementation:
app/action_init_logging.go(Logging configuration)pkg/types/general.go(Logging struct definition)
- Implementation:
-
RPC Endpoints:
- Implementation:
pkg/validate/try_connect.go(RPC connection validation)app/has_valid_rpc.go(RPC validation logic)
- Implementation:
-
Service Configuration:
- Implementation:
app/action_init_services.go(Services wizard implementation)pkg/types/service.go(Service struct definition and validation)
- Implementation:
-
Troubleshooting:
- Implementation: Error handling throughout the codebase, especially in:
app/action_daemon.go(Service error handling)app/config.go(Configuration error handling)
- Implementation: Error handling throughout the codebase, especially in:
-
Wizard Interface:
- Implementation:
pkg/wizard/directory (Wizard framework)app/action_init.go(Wizard initialization)
- Implementation:
Technical Index (from Technical Appendices)
- Address Monitoring: Section 3, Core Functionalities
- API Access: Section 3, Core Functionalities
- Architecture Overview: Section 2, System Architecture
- Blockchain Indexing: Section 3, Core Functionalities
- Configuration Files: Section 4, Technical Design
- Data Flow: Section 4, Technical Design
- Error Handling: Section 4, Technical Design
- Integration Points: Section 8, Integration Points
- IPFS Integration: Section 3, Core Functionalities; Section 8, Integration Points
- Logging: Section 4, Technical Design
- Performance Tuning: Section 7, Performance and Scalability (benchmarks removed; only tuning guidance retained)
- REST API: Section 3, Core Functionalities; Section 8, Integration Points
- RPC Requirements: Section 5, Supported Chains
- Scalability Strategies: Section 7, Performance and Scalability
- System Components: Section 2, System Architecture
- Testing Guidelines: Section 9, Testing and Validation